
Wikipedia:WikiProject AP Biology Bapst 2015

1. DNA
2. Enhancer
3. Promoter
4. Gene
5. Transcription Activator Protein
6. Mediator Protein
7. RNA Polymerase

- Past Related Projects: Wikipedia:WikiProject AP Biology Bapst 2012, Wikipedia:WikiProject AP Biology Bapst 2013, & Wikipedia:WikiProject AP Biology Bapst 2014
A high school class in Maine - John Bapst Memorial High School in Bangor, Maine - will contribute images to Wikipedia article and the commons until June 6, 2015. The collective goal is to contribute excellent biology diagrams to the Commons and to corresponding Wikipedia articles. This is done as part of an Advanced Placement Biology course. The lead editor is Chris Packard. This project is inspired by the 2009 Wikipedia AP Biology Project. There are many basic and important diagrams missing from biological articles and we're doing our part to fix this.
- Students will work alone, there are 48 students so we should have 48 new images with captions and labels.
- The time frame will be three weeks.
- Students will be required to write a summary of why they select a topic; hopefully, eliminating obscure, random topic selections. They also must create labels and captions for their photos
- They may add it to encyclopedia articles.
- The best of the bunch will be submitted as Wikipedia featured pictures, see other candidates here. Featured images must be in .svg (vector) format.
Feel free to discuss this project. Please notify me of any concerns; especially if they involve the behavior of my students on Wikipedia. With a little patience, this should be an inspirational experience for all.
Goals / Motivation
- To create a situation that not only vigorously enhances our ability to make quality decisions but also to improve our traction on the roads of 'Merica
- To improve the images in Wikipedia's coverage of Biology articles.
- To encourage promising students to write, create, learn, and contribute volunteer efforts through a service learning project.
- The dreaded “Research Project” is a standard hurdle for most AP Programs. Rightfully so, being that many college courses require such publications to validate your existence. This new approach to constructing a scientific document, is far more authentic and interesting. Rather than researching for a paper that is destined for the teacher's eyes and then a one way trip to the circular bin, let us contribute to the world-wide data base for others to benefit. I hope this will be an interesting and memorable project and assessment. It's funny, I can remember a number of projects and papers I wrote during my own high school experience, but I can remember no tests whatsoever.
Contributions
As you upload your projects and add them to Wikipedia please add them to the gallery below. By adding a new line which begins with the word "File" and them follows the format of my sample image. Make sure to include your caption.
-
 A numbers pyramid shows the relevant number of organisms that each trophic level occupies in an ecosystem. Often, there are more producers than consumers, however, it can also be seen in many ecosystems that there are more primary consumers that producers.
 -
 Muscles will contract or relax when they receive signals from the nervous system. The neuromuscular junction is the site of the signal exchange. The steps of this process in vertebrates occur as follows:(`) The action potential reaches the axon terminal. (2) Voltage-dependent calcium gates open, allowing calcium to enter the axon terminal. (3) Neurotransmitter vesicles fuse with the presynaptic membrane and acetylcholine (ACh) is released into the synaptic cleft via exocytosis. (4) ACh binds to postsynaptic receptors on the sarcolemma. (5) This binding causes ion channels to open and allows sodium ions to flow across the membrane into the muscle cell. (6) The flow of sodium ions across the membrane into the muscle cell generates an action potential which travels to the myofibril and results in muscle contraction. Labels: A: Motor Neuron Axon B: Axon Terminal C: Synaptic Cleft D: Muscle Cell E: Part of a Myofibril
 -
 A biomass pyramid shows the total mass of the organisms that each trophic level occupies in an ecosystem. Usually, producers have a higher biomass than any other trophic level. There must be higher amounts of biomass at the bottom of the pyramid to support the energy and biomass requirements of the higher trophic levels.
 -
 The average cell will divide between 50-70 times before cell death. As the cell divides the telomeres on the end of the chromosome get smaller. The Hayflick Limit is the theory that due to the telomeres shortening through each division, the telomeres will eventually no longer be present on the chromosome. This end stage is known as senescence and proves the concept that links the deterioration of telomeres and aging.
 -
 Despite the vast difference in neck length the okapi (left) and the giraffe (right) have seven cervical vertebrae.
 -
 This gene linkage map shows the relative positions of allelic characteristics on the second Drosophila chromosome. The alleles on the chromosome form a linkage group due to their tendency to form together into gametes. The distance between the genes (map units) are equal to the percentage of crossing-over events that occurs between different alleles. This diagram is also based on the findings of Thomas Hunt Morgan in his Drosophila cross.
 -
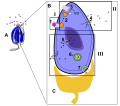
 The diagram depicted above shows the signal transduction pathway of the bitter taste. Bitter taste has many different receptors and signal transduction pathways. Bitter indicates poison to animals. It is most similar to sweet. Object A is a taste bud, object B is one taste cell, and object C is a neuron attached to object B. I. Part I is the reception of a molecule.1. A bitter substance such as quinine, is consumed and binds to G Protein-coupled receptors.II. Part II is the transduction pathway 2. Gustducin, a G protein second messenger, is activated. 3. Phosphodiesterase, an enzyme, is then activated. 4. Cyclic nucleotide, cNMP, is used, lowering the concentration 5. Channels such as the K+, potassium, channels, close.III. Part III is the response of the taste cell. 6. This leads to increased levels of Ca+. 7. The neurotransmitters are activated. 8. The signal is sent to the neuron.
 -
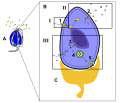 The diagram depicts the signal transduction pathway of the sour or salty taste. Object A is a taste bud, object B is a taste receptor cell within object A, and object C is the neuron attached to object B. I. Part I is the reception of hydrogen ions or sodium ions. 1. If the taste is sour, H+ ions, from an acidic substances, pass through their specific ion channel. Some can go through the Na+ channels. If the taste is salty Na+, sodium, molecules pass through the Na+ channels. Depolarization takes place II. Part II is the transduction pathway of the relay molecules.2. Cation, such as K+, channels are opened. III. Part III is the response of the cell. 3. An influx of Ca+ ions is activated.4. The Ca+ activates neurotransmitters. 5. A signal is sent to the neuron attached to the taste bud.
 -
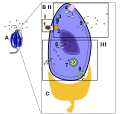
 The diagram above depicts the signal transduction pathway of the sweet taste. Object A is a taste bud, object B is one taste cell of the taste bud, and object C is the neuron attached to the taste cell. I. Part I shows the reception of a molecule. 1. Sugar, the first messenger, binds to a protein receptor on the cell membrane. II. Part II shows the transduction of the relay molecules. 2. G Protein-coupled receptors, second messengers, are activated. 3. G Proteins activate adenylate cyclase, an enzyme, which increases the cAMP concentration. Depolarization occurs. 4. The energy, from step 3, is given to activate the K+, potassium, protein channels.III. Part III shows the response of the taste cell. 5. Ca+, calcium, protein channels is activated.6. The increased Ca+ concentration activates neurotransmitter vesicles. 7. The neuron connected to the taste bud is stimulated by the neurotransmitters.
 -
 Functional proteins have four levels of structural organization:
 -
 Process of Denaturation: 1) Functional protein showing a quaternary structure 2) when heat is applied it alters the intramolecular bonds of the protein 3) unfolding of the polypeptides (amino acids)
 -
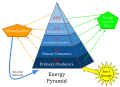 An energy pyramid is a presentation of the trophic levels in an ecosystem. Energy from the sun is transferred through the ecosystem by passing through various trophic levels. Roughly 10% of the energy is transferred from one trophic level to the next, thus preventing a large number of trophic levels. There must be higher amounts of biomass at the bottom of the pyramid to support the energy and biomass requirements of the higher trophic levels.
 -
 Here is a diagram that shows the differences between Endocrine and Exocrine glands. The major difference is that Exocrine glands secrete substances out of the body and Endocrine glands secrete substances into capillaries and blood vessels.
 -
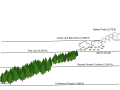 The bottom of the diagram shows the lowest section of vegetation: coniferous forest. This is around 3,500 ft above sea level, and some species include red pine and balsam fir. Just above these conifers, the mountain becomes a slightly steeper grade, from about 3,500 to 4,000 ft above sea level, and due to poor soil and constant heavy wind, the trees start to have stunted growth. They continue to be conifers, but are slightly smaller. Then we reach the tablelands, which is above the treeline (4,200 ft), and has alpine communities, comprised of a variety of shrubs. Above the alpine communities, there is just lichen growing on rocks, which can reach one mile above sea level.
 -
 Here is a reconstruction of the skull of an early dromaeosaur Sinornithosaurus millenii. Based on the rare grooves on the teeth and possible soft tissue located above the teeth, this small but deadly raptor is hypothesized to have had a poisonous bite and is the first known venomous dinosaur.
A: Venom Sacs
B: Venom Duct
C: Grooves in Teeth
D:Maxillary Fang -
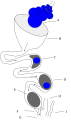 1: Seen here is a diagram of a female chicken reproduction system. A. Mature ovum, B. Infundibulum, C. Magnum, D. Isthmus, E. Uterus, F. Vagina, G. Cloaca, H. Large intestine, I. rudiment of right oviduct
 -
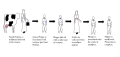 The process above shows the steps taken by Edward Jenner to create vaccination. Edward Jenner, the father of vaccination, created the first vaccine for smallpox. He did this by inoculating James Phipps with cowpox, a similar virus of smallpox, to create immunity, unlike variolation, which used smallpox to create an immunity to itself.
 -
 1: A cell sample is taken- usually a cheek swab or blood test 2: DNA is extracted from sample 3: Cleavage of DNA by restriction enzyme- the DNA is broken into small fragments 4: Small fragments are amplified by the Polymerase Chain Reaction- results in many more fragments 5: DNA fragments are separated by electrophoresis 6: The fragments are transferred to an agar plate 7: On the Agar Plate specific DNA fragments are bound to a radioactive DNA probe 8: The Agar Plate is washed free of excess probe 9: An x-ray film is used to detect a radioactive pattern 10: The DNA is compared to other DNA samples
 -
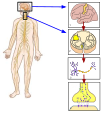 1. (Brain) Precentral gyrus: the origin of nerve signals initiating movement. 2. (Cross Section of Spinal Cord) Corticospinal tract: Mediator of message from brain to skeletal muscles. 3. Axon: the messenger cell that carries the command to contract muscles. 4. Neuromuscular junction: the messenger axon cell tells muscle cells to contract at this intersection
 -
 Memory B cell response on first, and second infections of a virus.
1. Antigens from the virus are brought into the body, and are then accepted by the receptors on the B cells.
2. The B cells accept the antigens, and then start to allow the antigens to change the antibodies and the B cell.
3. The B cells either change into memory B cells, or create plasma cells that secrete the newly changed antigens.
4. On the second infection when that same viruses antigens are present the memory B cells recognize this virus. This causes a much larger response from these memory B cells compared to the first response of the B cells.
5. Since there was a much larger response from the Memory B cells this causes more plasma cells to be produced as a response. When there are more abundant plasma cells, more antibodies are then produced as a result of this. -
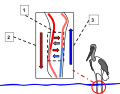 The exchange of heat in this diagram (1) is an example of countercurrent exchange. In this example the cold water requires the birds circulatory system to recycle heat and minimize heat loss through the skin. The warm arterial blood (2) flowing away from the heart warms up the cooler venous blood (3) heading towards the heart.
 -
![A graph of the cases of Human Brucellosis in the United States from the years 1993-2010 surveyed by the Centers for Disease Control and Prevention through the National Notifiable Diseases Surveillance System. References: [1]](//upload.wikimedia.org/wikipedia/commons/thumb/7/77/BrucellosisGraph.png/120px-BrucellosisGraph.png) A graph of the cases of Human Brucellosis in the United States from the years 1993-2010 surveyed by the Centers for Disease Control and Prevention through the National Notifiable Diseases Surveillance System. References: [1]
A graph of the cases of Human Brucellosis in the United States from the years 1993-2010 surveyed by the Centers for Disease Control and Prevention through the National Notifiable Diseases Surveillance System. References: [1] -
 Island Gigantism: This diagram displays the change of the weta species in two different ecosystems. The physical size and the population size of the weta is affected by the predation rate. A species of rat was introduced on the mainland. The rats then began to take over and prey on wetas. The high amount of a foreign predators decreases the amount of wetas drastically. As shown on the diagram, the weta shrinks in size, representing the drop in population and health of the species. The bottom diagram displays island gigantism. Island gigantism is the principle that species on an island isolated from predation will thrive due to more resources and less predation. The wetas are an example of this because on Little Barrier Island they have grown to a massive size for their species and have a high population. The Little Barrier Island wetas do not have rats preying on them, unlike those on the mainland. This has enabled them to grow to their great size. The giant weta species on islands are the only ones not facing extinction due to their geological advantage of being separated from the introduced rats. The diagram shows the growth of the weta as time goes on while also displaying how the birds begin to prey on them less due to their size.
 -
 Primary succession occurring over time. The soil depths increase due to decomposition of plant matter and there is a gradual increase of species diversity in the ecosystem.
 -
 The light from the lamp (1.) functions as a detectable change in the plant's environment. As a result, the plant exhibits a reaction of phototropism--directional growth (2.) toward the light stimulus.
 -
 Prokaryotic flagella run in a rotary movement, while eukaryotic flagella run in a bending movement. The prokaryotic flagella uses a rotary motor,and the eukaryotic flagella uses a complex sliding filament system. Eukaryotic flagella is ATP driven, while prokaryotes are proton driven.
 -
 This diagram shows co-dominance. In this example a white bull (WW) mates with a red cow (RR), and their offspring exhibit co-dominance expressing both white and red hairs.
 -
 Louis Pasteur’s pasteurization experiment illustrates the fact that the spoilage of liquid was caused by particles in the air rather than than the air itself. These experiments were important pieces of evidence supporting the idea of Germ Theory of Disease.
 -
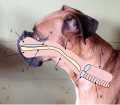 1. Nasal Cavity 2. Oral Cavity3. Soft Palate 4. Pharynx 5. Larynx 6. Trachea7. Esophagus 8. Nasopharynx 9. Hard Palate This diagram illustrates what the airway structure looks like in a brachycephalic dog; in this case, a Boxer. The brachycephalic dogs has a shorter snout which causes the airway to be shorter, that means all the parts that make up the airway get pushed closer together. Due to this phenomenon, a brachycephalic dog has an elongated soft palate which can cause most of the problems with the dogs breathing. They can also have problems getting enough air in because of their elongated soft palate and shorter airway.
 -
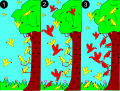 The Principle of Competitive Exclusion states that two species aren't able to coexist at constant population values competing for the same resource. In this example, stage 1 shows a smaller (yellow) species of bird originally foraging for insects across the whole tree. In stage 2, a larger, invasive (red) species of bird is introduced into the environment and competes with the yellow bird for resources. As time goes on, the invasive red species dominates the yellow species in competition for the middle part of the tree and for the more abundant resources, as shown in stage 3. The yellow species then adapts to it's new niche and both birds thrive without competition.
 -
 Positive feedback is the amplification of a body’s response to a stimulus. For example, in childbirth, when the head of the fetus pushes up against the cervix (1) it stimulates a nerve impulse from the cervix to the brain (2). When the brain is notified, it signals the pituitary gland to release a hormone called Oxytocin (3). Oxytocin is then carried via the bloodstream to the uterus (4) causing contractions, pushing the fetus towards the cervix eventually inducing childbirth.
 -
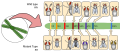
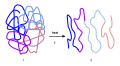
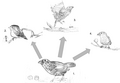
 Seen here is a four step diagram depicting the usage of an enhancer. Within this DNA sequence, protein(s) known as transcription factor(s) bind to the enhancer and increases the activity of the promoter.
1. DNA
2. Enhancer
3. Promoter
4. Gene
5. Transcription Activator Protein
6. Mediator Protein
7. RNA Polymerase -
 Seen here is a Parasaurolophus skull with a view into nasal cavity of the cranial crest. It is hypothesized that the Parasaurolophus pushed air through its long cranial crest to make low register sounds that could be heard for miles.
1. Nostril
2.
3.
4.
5.
6. -
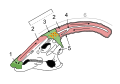
 Seen here is a diagram of the posterior part of a giant anteater. It is observable that the tongue of the anteater is attached directly to the sternum unlike most of the mammals, whose tongues are usually attached to the hyoid bone. Anteaters' tongues, on average, are 2 ft long.
A. Brain
B. Tongue
C. Sternum
D. Skull
E. Hyoid Bone -
![Pictured above is the process used to clone the Pyrenean ibex in 2009. The tissue culture was taken from the last living, female Pyrenean ibex named Celia. The egg was taken from a Goat (Capra hircus) and the nuclei removed to ensure the offspring was purely Pyrenean ibex. The egg was implanted into a surrogate goat mother for development. References: [2]](//upload.wikimedia.org/wikipedia/commons/thumb/1/16/Pyrenean_ibex_Cloning.svg/120px-Pyrenean_ibex_Cloning.svg.png) Pictured above is the process used to clone the Pyrenean ibex in 2009. The tissue culture was taken from the last living, female Pyrenean ibex named Celia. The egg was taken from a Goat (Capra hircus) and the nuclei removed to ensure the offspring was purely Pyrenean ibex. The egg was implanted into a surrogate goat mother for development. References: [2]
Pictured above is the process used to clone the Pyrenean ibex in 2009. The tissue culture was taken from the last living, female Pyrenean ibex named Celia. The egg was taken from a Goat (Capra hircus) and the nuclei removed to ensure the offspring was purely Pyrenean ibex. The egg was implanted into a surrogate goat mother for development. References: [2] -
![Seen here is a diagram depicting the bacteria, Clostridium tetani, which causes the tetanus infection known for its symptoms of muscle spasms and lockjaw. This bacteria is strongly durable due to its endospores, which can carry the infection's DNA even when the bacteria is dead. Pictured is the bacteria alone, with a spore being produced, and the spore alone. References: [3] [4] [5] [6]](//upload.wikimedia.org/wikipedia/commons/thumb/f/f2/Clostridium_Tetani.svg/77px-Clostridium_Tetani.svg.png) Seen here is a diagram depicting the bacteria, Clostridium tetani, which causes the tetanus infection known for its symptoms of muscle spasms and lockjaw. This bacteria is strongly durable due to its endospores, which can carry the infection's DNA even when the bacteria is dead. Pictured is the bacteria alone, with a spore being produced, and the spore alone. References: [3] [4] [5] [6]
Seen here is a diagram depicting the bacteria, Clostridium tetani, which causes the tetanus infection known for its symptoms of muscle spasms and lockjaw. This bacteria is strongly durable due to its endospores, which can carry the infection's DNA even when the bacteria is dead. Pictured is the bacteria alone, with a spore being produced, and the spore alone. References: [3] [4] [5] [6] -
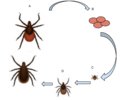 A. Female adults lays 1,500 eggs in the spring B. Eggs hatch C. Larva feed on smaller mammals D. Larva grow to Nymphs and the nymphs feed on larger mammals including people E. Larva become adults and feed on large mammals.
 -
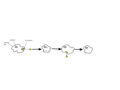
 Diagram illustrating how Cuscuta uses haustoria to penetrate the vascular system of its host plant and remove sugars and nutrients from the host's phloem.
1). Cuscuta plant
2). Host plant
3). Cuscuta leaves
4). Ground tissue
5). Phloem
6). Sugars and nutrients
7). Epidermal tissue
8). A Cuscuta haustorium growing into the phloem of the host plant. -
![Seen here is a diagram of agarose gel for DNA Profiling: RFLP (restriction fragment length polymorphism) Analysis. To the left is a picture of a DNA fingerprinting experiment, and the diagram on the right is the line drawing of the picture to show the distributions of DNA fragments. By comparing the ditributions, people can determine which suspect is guilty. The reason that DNA fragments move to different distances is they have different lengths and sizes: shorter/smaller fragments would move faster and further. Under an electric field, nucleic acid molecules move negatively charged molecules through agarose gel, and identical fragments would move the same distance. 1. Known DNA 2. DNA of suspect 1 3. DNA of suspect 2 4. DNA from the crime scene A. DNA fragments: larger fragments B. Wells: where people load DNA samples C. DNA fragments: smaller fragments that are further separated D. Agarose gel: electric field References:[7]](//upload.wikimedia.org/wikipedia/commons/thumb/c/c8/DNA_Profiling_-_RFLP_Analysis.svg/120px-DNA_Profiling_-_RFLP_Analysis.svg.png) Seen here is a diagram of agarose gel for DNA Profiling: RFLP (restriction fragment length polymorphism) Analysis. To the left is a picture of a DNA fingerprinting experiment, and the diagram on the right is the line drawing of the picture to show the distributions of DNA fragments. By comparing the ditributions, people can determine which suspect is guilty. The reason that DNA fragments move to different distances is they have different lengths and sizes: shorter/smaller fragments would move faster and further. Under an electric field, nucleic acid molecules move negatively charged molecules through agarose gel, and identical fragments would move the same distance.
Seen here is a diagram of agarose gel for DNA Profiling: RFLP (restriction fragment length polymorphism) Analysis. To the left is a picture of a DNA fingerprinting experiment, and the diagram on the right is the line drawing of the picture to show the distributions of DNA fragments. By comparing the ditributions, people can determine which suspect is guilty. The reason that DNA fragments move to different distances is they have different lengths and sizes: shorter/smaller fragments would move faster and further. Under an electric field, nucleic acid molecules move negatively charged molecules through agarose gel, and identical fragments would move the same distance.
1. Known DNA
2. DNA of suspect 1
3. DNA of suspect 2
4. DNA from the crime scene
A. DNA fragments: larger fragments
B. Wells: where people load DNA samples
C. DNA fragments: smaller fragments that are further separated
D. Agarose gel: electric field
References:[7] -
![This graph shows the main taxonomic ranks: domain, kingdom, phylum, class, order, family, genus, and species. This graph demonstrates how taxonomic ranking is used to designate related animals, the example used in this graph is the red fox (Vulpes vulpes). References: [8]](//upload.wikimedia.org/wikipedia/commons/thumb/7/71/Taxonomic_Rank_Graph.svg/120px-Taxonomic_Rank_Graph.svg.png) This graph shows the main taxonomic ranks: domain, kingdom, phylum, class, order, family, genus, and species. This graph demonstrates how taxonomic ranking is used to designate related animals, the example used in this graph is the red fox (Vulpes vulpes). References: [8]
This graph shows the main taxonomic ranks: domain, kingdom, phylum, class, order, family, genus, and species. This graph demonstrates how taxonomic ranking is used to designate related animals, the example used in this graph is the red fox (Vulpes vulpes). References: [8] -
![A gene gun is used for injecting cells with genetic information, it is also known as biolistic particle delivery system. Gene guns can be used effectively on most cells but are mainly used on plant cells. Step 1 The gene gun apparatus is ready to fire. Step 2 When the gun is turned on and the helium flows through. Step 3 The helium moving the disk with DNA coated particles toward the screen. Step 4 The helium having pushed the particles moving through the screen and moving to the target cells to transform the cells. Reference: [9]](//upload.wikimedia.org/wikipedia/commons/thumb/5/53/Gene_Gun.svg/120px-Gene_Gun.svg.png) A gene gun is used for injecting cells with genetic information, it is also known as biolistic particle delivery system. Gene guns can be used effectively on most cells but are mainly used on plant cells. Step 1 The gene gun apparatus is ready to fire. Step 2 When the gun is turned on and the helium flows through. Step 3 The helium moving the disk with DNA coated particles toward the screen. Step 4 The helium having pushed the particles moving through the screen and moving to the target cells to transform the cells. Reference: [9]
A gene gun is used for injecting cells with genetic information, it is also known as biolistic particle delivery system. Gene guns can be used effectively on most cells but are mainly used on plant cells. Step 1 The gene gun apparatus is ready to fire. Step 2 When the gun is turned on and the helium flows through. Step 3 The helium moving the disk with DNA coated particles toward the screen. Step 4 The helium having pushed the particles moving through the screen and moving to the target cells to transform the cells. Reference: [9] -
 This model is a representation of the process of Diabetic Ketoacidosis. A: Muscle Fiber B: Amino Acids C: Liver E: Fatty Acids F: Glucagon G: Blood Vessel 1. Lack of insulin leads to the release of amino acids from the muscle fiber. 2. Amino acids are released from the muscle fiber, which get converted into glucose inside of the liver. 3. The Glucose produced becomes abundant in the bloodstream. 4. Fatty Acids and Glycerol are released from the adipose tissue, which get converted into ketones inside of the liver. 5. Along with the Fatty Acids and Glycerol, the Glucose produced from the lack of insulin also gets converted into ketones inside of the liver. 6. The ketones produced become abundant in the bloodstream. This leads to high blood sugar levels, nausea, vomiting, thirst, excessive urine production, and abdominal pain. Partially derived from: http://en.wikipedia.org/wiki/Glucagon
 -
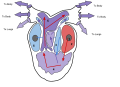
 The human heart (left) and chicken heart (right) share many similar characteristics. Avian hearts pump faster than mammalian hearts. Due to the faster heart rate, the muscles surrounding the ventricles of the chicken heart are thicker. Both hearts are labeled with the following parts: 1. Ascending Aorta 2. Left Atrium 3. Right Atrium 4. Right Ventricle 5. Left Ventricle
 -
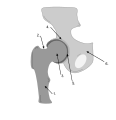 This diagram shows the anatomy of the ball and socket joint found in the hip. (1) The femur is the long thigh bone that connects to the pelvis through a ball and socket joint. The femur has a femoral neck and a femoral head. (2) The femoral neck is the part of the femur that connects the long part of the bone (femoral shaft) to the femoral head. (3) The femoral head is the rounded piece of the femur that is called the “ball” in the ball and socket joint of the hip. (4) The acetabulum is the socket in the pelvis in which the femoral head fits to form the hip joint. (5) The acetabular labrum is soft tissue that surrounds the acetabulum to provide stability to the hip and protection to the surface of the joint. (6) The pelvis is connected to the femur to form the hip joint. Reference: https://en.wiki2.org/wiki/Hip_arthroscopy
 -
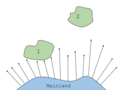 This diagram shows the effect of an island’s distance from the mainland on the amount of species richness. The sizes of the two islands are approximately the same. Island 1 receives more random dispersion of organisms. While island number 2, since it is farther away, receives less random dispersion of organisms.
 -
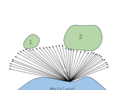 This diagram shows the effect of an island’s size on the amount of species richness. The diagram shows two islands equidistant from the mainland. Island 1 receives less random dispersion of organisms. While island 2 receives more of the arrows and therefore more random dispersion of organisms.
 -
 The animation shows how contractile vacuole regulates water in paramecium. Water is taken up by canals, and expelled by the contraction of contractile vacuole. A: The contractile vacuole is full of water. The canals are closed. B: The vacuole starts loosing water. A pore appears on the vacuole, and water moves from inside of vacuole to outside. C:The vacuole is empty. Canals are ready to open for taking up water. D: Contractile Vacuole gains water from cytoplasm. Water moves from canals to vacuole, which makes vacuole become much bigger.
 -
 These charts depict the different types of genetic selection. On each graph, the x-axis variable is the type of phenotypic trait and the y-axis variable is the amount of organisms. Group A is the original population and Group B is the population after selection. Graph 1 shows directional selection, in which a single extreme phenotype is favored. Graph 2 depicts stabilizing selection, where the intermediate phenotype is favored over the extreme traits. Graph 3 shows disruptive selection, in which the extreme phenotypes are favored over the intermediate.
 -
 1. Pulmonary Vein, 2. Left Atrium, 3.
 -
The animation shows how contractile vacuole regulates water in paramecium. Water is taken up by canals, and expelled by the contraction of contractile vacuole. A: The contractile vacuole is full of water. The canals are closed. B: The vacuole starts loosing water. A pore appears on the vacuole, and water moves from inside of vacuole to outside. C:The vacuole is empty. Canals are ready to open for taking up water. D: Contractile Vacuole gains water from cytoplasm. Water moves from canals to vacuole, which makes vacuole become much bigger.
-
 Above is a diagram of an open circulatory system. An open circulatory system is made up of a heart, vessels, and hemolymph. This diagram shows how the hemolymph, fluid present in most invertebrates that is equivalent to blood, is circulated throughout the body of a grasshopper. The hymolymph is first pumped through the heart, into the aorta, dispersed into the head and throughout the hemocoel, then back through the ostium that are located in the heart, where the process is repeated.
 -
 In chromosomal crossover, any two genes on the chromosome have a different percent chance in crossing over together. The closer the genes are to one another the lower percent chance they will cross over together, the further they are apart the higher percent chance they will cross over together.
 -
 Seen here is adapted radiation of finch A. (Geospiza magnirostris) into three other species of finches found on the Galapagos Islands. Due to the absence of other species of birds, the finches adapted to new niches. The finches beaks and bodies changed allowing them to eat certain types of foods such as nuts, fruits, and insects.
1. Geospiza magnirostris
2. Geospiza parvula
3. Certhidea olivacea
4. Geospiza fortis -
 Shown above, x-bacteria is infecting the amoeba cell. The cell does not recognize the bacteria and gets sick(this is replicated by change in size of the amoeba cell). Eventually the amoeba becomes dependent on the x-bacteria. The x-bacteria is shown leaving the amoeba cell and the cell becomes sick again. This diagram replicates the studies of microbiologist Kwang Jeon in 1966.
 -
 Above is a diagram that depicts Transected Pancreatic Tail Syndrome. Transected Pancreatic Tail Syndrome ( TPTS ) is a rare medical condition where there is a lack of a ductal connection between the upper portion of the pancreatic tissue, and the lower portion of tissue. 1- The tail is disconnected from the upper portion of the pancreas. This breaks the duct between the two portions, causing pancreatic enzymes to secrete into the bowel. 2- The head of the pancreas would be considered upper stream pancreatic tissue that remains less vulnerable to damage than the tail. 3- The pancreatic duct when in a healthy pancreas connects the entire pancreas. However in this transected pancreas, the duct is disrupted and unable to function. 4- The cut or transected area that shows a disconnection in the pancreas. An injury of this nature commonly requires invasive surgery to treat.


.svg)


![A graph of the cases of Human Brucellosis in the United States from the years 1993-2010 surveyed by the Centers for Disease Control and Prevention through the National Notifiable Diseases Surveillance System. References: [1]](/File:BrucellosisGraph.png)


.svg)


![Pictured above is the process used to clone the Pyrenean ibex in 2009. The tissue culture was taken from the last living, female Pyrenean ibex named Celia. The egg was taken from a Goat (Capra hircus) and the nuclei removed to ensure the offspring was purely Pyrenean ibex. The egg was implanted into a surrogate goat mother for development. References: [2]](/File:Pyrenean_ibex_Cloning.svg)
![Seen here is a diagram depicting the bacteria, Clostridium tetani, which causes the tetanus infection known for its symptoms of muscle spasms and lockjaw. This bacteria is strongly durable due to its endospores, which can carry the infection's DNA even when the bacteria is dead. Pictured is the bacteria alone, with a spore being produced, and the spore alone. References: [3] [4] [5] [6]](/File:Clostridium_Tetani.svg)


![Seen here is a diagram of agarose gel for DNA Profiling: RFLP (restriction fragment length polymorphism) Analysis. To the left is a picture of a DNA fingerprinting experiment, and the diagram on the right is the line drawing of the picture to show the distributions of DNA fragments. By comparing the ditributions, people can determine which suspect is guilty. The reason that DNA fragments move to different distances is they have different lengths and sizes: shorter/smaller fragments would move faster and further. Under an electric field, nucleic acid molecules move negatively charged molecules through agarose gel, and identical fragments would move the same distance. 1. Known DNA 2. DNA of suspect 1 3. DNA of suspect 2 4. DNA from the crime scene A. DNA fragments: larger fragments B. Wells: where people load DNA samples C. DNA fragments: smaller fragments that are further separated D. Agarose gel: electric field References:[7]](/File:DNA_Profiling_-_RFLP_Analysis.svg)
![A gene gun is used for injecting cells with genetic information, it is also known as biolistic particle delivery system. Gene guns can be used effectively on most cells but are mainly used on plant cells. Step 1 The gene gun apparatus is ready to fire. Step 2 When the gun is turned on and the helium flows through. Step 3 The helium moving the disk with DNA coated particles toward the screen. Step 4 The helium having pushed the particles moving through the screen and moving to the target cells to transform the cells. Reference: [9]](/File:Gene_Gun.svg)


.svg)
.png)
.png)


![[2]](https://upload.wikimedia.org/wikipedia/commons/b/b4/Pyrenean_Ibex.png)
Contributors
Add your user name here following my example. Just add this template with your username instead of the line: {{user|username}} and then, if your username is not identifiable, your real first name.
- ekann (talk · contribs) - Elias Kann - Counter current exchange
- Cbechtel16037 (talk · contribs) - Colin - Gene Linkage
- Jcheff (talk · contribs) - Jon Cheff - Enhancer (Genetics)
- Ralph Walterberg (talk · contribs) - Braydon - Myelin Sheath Cross Section
- Earthdirt (talk · contribs) - Christopher (AKA Mr. Packard) - IMAGE TOPIC NAME HERE
- Swiggity.Swag.YOLO.Bro (talk · contribs) - Dixon - Ecological pyramid
- kholmes16 (talk · contribs) - Kailey - Tetanus
- kgerow16 (talk · contribs) - Kennedy - Germ Theory of Disease
- 15ldavenport (talk · contribs) - Lucas- De-extinction
- scurran15 (talk · contribs) - Shannon - Denaturation (biochemistry)
- asianinvasion12 (talk · contribs) - Sarah - Okapi
- Sebastian Josephus Odenbacker (talk · contribs) - Paul - Sinornithosaurus Skull
- nreese22 (talk · contribs) - Nate - Memory B
- mgaetani (talk · contribs) - Mitchel- Flagella'
- jessicasquid (talk · contribs) - Jisika - Anteater
- sneptunebear16 (talk · contribs) - Selena - Paternity test
- keyanapardilla98 (talk · contribs) - KeyanaAvian reproductive system
- mdunton16 (talk · contribs)- MackenzieOpen Circulatory System
- dhanscom17 (talk · contribs) - Darren - Competitive Exclusion Principle
- azmistowski17 (talk · contribs) - Anna - Hayflick Limit
- BaileyMartin15 (talk · contribs) -Bailey - Brachycephalic dog airway structure
- Phoenix_src (talk · contribs) - Phoenix - DNA-Profiling
- Maliyanbinette (talk · contribs) - Maliyan - Dodder
- sjoyce17 (talk · contribs) - Sean - Avian heart vs Mammal heart
- jmalvin17 (talk · contribs) - Jackie - Darwin's Finches Adapted Radiation
- twaanders17 (talk · contribs) - Tiffany - Gene Mapping
- gblanchard16 (talk · contribs) - Gabe - Diabetic Ketoacidosis
- kpricey15 (talk · contribs) - Kara - Island Gigantism
- ccarroll17 (talk · contribs) -Courtney - Trophic Cascade
- hldavis4 (talk · contribs) -Heather- Signal Pathway of Taste
- elliejellybelly13 (talk · contribs) -Ellie--
- mtomanelli15 (talk · contribs) -Mari--Stimulus (physiology)
- katyddd (talk · contribs)-Katy-Contractile vacuole
- hhughes15 (talk · contribs) - Haley - Roan Cattle and Codominance
- hannah.gray05 (talk · contribs)- Hannah- "Positive feedback--Childbirth"
- pathogendestroyingphagocytesoftheinnateresponseteam (talk · contribs) - Tommy - Baxter State Park Ecosystem
- kcotton15 (talk · contribs)- Katie - Ball and Socket joint (hip)
- mntrue15 (talk · contribs)- Maegan - Alzheimer's Disease
- hdelucalowell15 (talk · contribs) - Haley - Insular Biogeography'
- isa.tomanelli (talk · contribs)- Isa - Somatic Nervous System
- PianaB.19 (talk · contribs)- Anna B. - Brucellosis
- srcyr16 (talk · contribs)-Shaylyn - Edward Jenner/small pox
- RachelBrooks15 (talk · contribs) -Rachel- Gene Gun
- bstoren15 (talk · contribs) - Brianna- Cloacal Respiration in Turtles
- ealbert17 (talk · contribs) - Evan - Distributive Types of Genetic Selection
- Cscanlon15 (talk · contribs) -Carley - Amphibian Circulatory System
- rcole17 (talk · contribs) - Rachel Cole - Succession
- ldelucalowell (talk · contribs)- Laddy- '"Endosymbiont"'
- Nninnabee (talk · contribs)- Annina- Taxonomic Rank
- cfhand15 (talk · contribs)- Caleb- Ixodidae lifecycle
- abustard16 (talk · contribs)- Aj- Transected Pancreatic Tail Syndrome
Uploading
In order to complete the assignment and reap all the benefits of your hard work (such as a good grade) you MUST complete all of the following steps. If you need help, just ask.
How to, step by step
Step 1: Create a Wikipedia Global account by clicking "Login/create account" in the upper right hand corner of this page.
Step 2: Click here to use the WikiCommons File Upload Wizard
Step 3: If you didn't do it in the Wizard, categorize your image by adding a one or more [[Category:_______]] tags at the bottom of the page (fill in the name of the category in the _______.) You might use Category:Biology diagrams (but that's not a very helpful category) or something more specific like Category:Molecular biology or something else appropriate.
Step 4: If you didn't do it in the Wizard you should also now add your labels and your caption information in the description to your upload page in the Commons.
Step 5: Your image is now available in all Wiki Projects, including Wikipedia. So let's add it to the article! Go to the article you want to add your donated image to. In the top of the section of the article or the subheading you want to add the image to add something like this:
[[File:MY IMAGE NAME.png|right|thumb|200px|The [[caption]] of '''my image'''.]]
That's not too hard is it? For your caption you'll need to follow Wikipedia style and use some mark up to do this - it's kind of like a micro-essay. The [[ ]] creates a link to the given page on Wikipedia and the ''' ''' make the word bold, in Wikipedia it's appropriate to bold the title of the article the first time it's used in the text or in a caption."
Step 6: Wow you've done it! Now you just have to turn in your work by adding it to gallery in the section above here called "Contributions". Just follow the model I provided in the first entry. Make sure that your entry is between the <gallery> and </gallery> tags or it won't show up. Your caption will likely have to be shorter than your description, see the style advice below.
Style guides
To get past the stumbling blocks of editing Wikipedia, articles will have to conform to the Wikipedia style guides. The largest barriers are:
- Wikipedia:Manual of Style/Images - The basic overview of images (the Wikipedia:Picture tutorial is also useful.
- Wikipedia:Manual of Style/Captions - Writing a good caption may be harder than you think.
- Wikipedia:Copyrights - Make sure to post a license on your image which releases all copyrights and makes it free use image AND don't use images from anywhere except the Commons if your image integrates other images.
- Wikipedia:File names - Pick the right name for your file.
- Wikipedia:Preparing images for upload - Pick the right file type (images created using entirely Google Draw should be saved as .SVG, whereas most other images you make will be saved as a .PNG in rare cases an a .JPG or .JPEG can be used)
- Wikipedia:Uploading images or WikiCommons Uploading Images - Do it right the first time (or just use the Wizard).
- Wikipedia:Ten things you may not know about images on Wikipedia - Kind of interesting.
You can always ask for help at:
Writing a good image caption
There are several criteria for a good caption. A good caption:
- clearly identifies the subject of the picture, without detailing the obvious.
- is succinct (that means short).
- establishes the picture's relevance to the article.
- provides context for the picture.
- draws the reader into the article.
Different people read articles different ways. Some people start at the top and read each word until the end. Others read the first paragraph and scan through for other interesting information, looking especially at pictures and captions. For those readers, even if the information is adjacent in the text, they will not find it unless it is in the caption—but do not tell the whole story in the caption—use the caption to make the reader curious about the subject.
Another way of approaching the job: imagine you're giving a lecture based on the encyclopedia article, and you are using the image to illustrate the lecture. What would you say while attention is on the image? What do you want your audience to notice in the image, and why? Corollary: if you have got nothing to say, then the image probably does not belong in the article.
Images for the lead
It is very common to use an appropriate representative image for the lead of an article, often as part of an infobox. The image helps to provide a visual association for the topic, and allows readers to quickly assess if they have arrived at the right page. For most topics, the selection of a lead image is plainly obvious: a photograph or artistic work of a person, photographs of a city, or a cover of a book or album, to name a few.
Image selection for other topics may be more difficult and several possible choices could be made. While Wikipedia is not censored, as outlined in the above section on offensive images, the selection of the lead image should be made with some care with respect to this advice. Lead images are loaded and shown upon navigating to the page, and are one of the first things that readers will see. Editors should avoid using images that readers would not have expected to see when navigating to the page. Unlike other content on a page that falls below the lead, the lead image should be chosen with these considerations in mind.
Some advice on selecting a lead image include the following:
- Lead images should be images that are natural and appropriate visual representations of the topic; they not only should be illustrating the topic specifically, but should also be the type of image that is used for similar purposes in high-quality reference works, and therefore what our readers will expect to see. Lead images are not required, and not having a lead image may be the best solution if there is no easy representation of the topic.
- Lead images should be selected to be of least shock value; if an alternative image exists that still is an accurate representation of the topic but without shock value, it should always be preferred. For example, using an image of deportees being subjected to selection as the lead image at this version of Holocaust is far preferable to the appropriate images that appear later in the article that show the treatment of the prisoners or corpses from the camps.
- Sometimes it is impossible to avoid the use of a lead image with perceived shock value if the topic itself is of that nature, for example in articles on various parts of human genitalia. It should be anticipated, through Wikipedia:Content disclaimer, that readers will be aware they will be exposed to potentially shocking images when navigating to articles on such topics.
Planning and resources
- Wikipedia tutorials for beginners
- Editing commands cheatsheet
- Getting started
- The perfect article
- Assessment
- Article development
- Peer Review
- [[Active gif creator]]
Talk pages
These are places where you can leave and receive messages and questions, every page has one. Whenever you edit these pages, make sure that you are signed in. Also, add four tildes ~~~~ to the end of all comments you make on talk pages. This will let people know who is talking.