
User:TheKommisar/sandbox
±

 Socialist Republic of Italy
 CNT-FAI
 United States of America
 California
 Confederate States of America
 Union State
 Commune of France
 American Union State
 Combined Syndicates of America
 Minutemen
 Abraham Lincoln Brigade 1st Batallion
| |||||||||||||||||||||||||||||||||||||||||||||||||||||||||||||||||||||||||||||||||||||||||||||
All 71 seats in the House of Representatives 36 seats needed for a majority | |||||||||||||||||||||||||||||||||||||||||||||||||||||||||||||||||||||||||||||||||||||||||||||
|---|---|---|---|---|---|---|---|---|---|---|---|---|---|---|---|---|---|---|---|---|---|---|---|---|---|---|---|---|---|---|---|---|---|---|---|---|---|---|---|---|---|---|---|---|---|---|---|---|---|---|---|---|---|---|---|---|---|---|---|---|---|---|---|---|---|---|---|---|---|---|---|---|---|---|---|---|---|---|---|---|---|---|---|---|---|---|---|---|---|---|---|---|---|
| Opinion polls | |||||||||||||||||||||||||||||||||||||||||||||||||||||||||||||||||||||||||||||||||||||||||||||
| Registered | 741,007 | ||||||||||||||||||||||||||||||||||||||||||||||||||||||||||||||||||||||||||||||||||||||||||||
| Turnout | 564,647 (76.2%) ( | ||||||||||||||||||||||||||||||||||||||||||||||||||||||||||||||||||||||||||||||||||||||||||||
| |||||||||||||||||||||||||||||||||||||||||||||||||||||||||||||||||||||||||||||||||||||||||||||
 Results of the election, showing the winner of each single-member electorate and the distribution of list seats. | |||||||||||||||||||||||||||||||||||||||||||||||||||||||||||||||||||||||||||||||||||||||||||||
| |||||||||||||||||||||||||||||||||||||||||||||||||||||||||||||||||||||||||||||||||||||||||||||
.jpg)


| |||||||||||||||||||||||||||||
538 members of the Electoral College 270 electoral votes needed to win | |||||||||||||||||||||||||||||
|---|---|---|---|---|---|---|---|---|---|---|---|---|---|---|---|---|---|---|---|---|---|---|---|---|---|---|---|---|---|
| Opinion polls | |||||||||||||||||||||||||||||
| Turnout | 57.2%[2] | ||||||||||||||||||||||||||||
| |||||||||||||||||||||||||||||
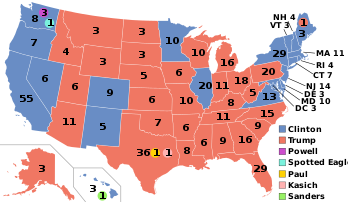 Presidential election results map. Red denotes states won by McCain/Cantor and Blue denotes those won by Carter/Obama. Numbers indicate electoral votes cast by each state and the District of Columbia. | |||||||||||||||||||||||||||||
| |||||||||||||||||||||||||||||
.jpg)
.jpg)
- ^ "General Election 2017: full results and analysis". UK Parliament (second ed.). 29 January 2019. Retrieved 6 April 2022.
- ^ ("Official 2016 Presidential General Election Results" (PDF). Federal Election Commission. December 2017. Retrieved February 12, 2018.) ("Voting and Registration in the Election of November 2016". United States Census Bureau. May 2017. Retrieved November 10, 2017.)
- ^ a b Cite error: The named reference
e2016was invoked but never defined (see the help page).