
Mount Vernon, Kentucky
Mount Vernon, Kentucky | |
|---|---|
 Downtown Mount Vernon (2011) | |
 Location within Rockcastle County & Kentucky | |
| Coordinates: 37°22′08″N 84°20′05″W / 37.36889°N 84.33472°W | |
| Country | United States |
| State | Kentucky |
| County | Rockcastle |
| Incorporated | 1818[1] |
| Reïncorporated | 1866[1] |
| Named for | George Washington's Virginia home |
| Area | |
| • Total | 2.83 sq mi (7.32 km2) |
| • Land | 2.81 sq mi (7.29 km2) |
| • Water | 0.01 sq mi (0.03 km2) |
| Elevation | 1,221 ft (372 m) |
| Population (2020) | |
| • Total | 2,453 |
| • Estimate (2022)[4] | 2,472 |
| • Density | 871.71/sq mi (336.52/km2) |
| Time zone | UTC-5 (Eastern (EST)) |
| • Summer (DST) | UTC-4 (EDT) |
| ZIP code | 40456 |
| Area code | 606 |
| FIPS code | 21-54174 |
| GNIS feature ID | 2404325[3] |
| Website | City website |
Mount Vernon is a home rule-class city[5] and the seat of Rockcastle County in southeastern Kentucky. The intersection of U.S. Routes 25 and 150 is located here. The population was 2,477 at the time of the 2010 U.S. census. Mount Vernon is part of the Richmond-Berea micropolitan area.
History

The area was first settled by European Americans in 1790 after the American Revolutionary War, around a feature called Spout Springs. Much of the area was originally swampland. The settlement was named for George Washington's home, Mount Vernon. The Wilderness Road was constructed to this town in 1792, and this was the principal settlement when Rockcastle Co. was created in 1810.
In 1883, an L&N spur was built through the town, connecting it by rail to Louisville and Knoxville. The county's first newspaper, the Mount Vernon Signal, began publication in 1887. Although it was still a largely rural town and county in the late 20th century, the construction of I-75 in the 1970s has drawn some industry to the area. The population has increased about 50% from 1,639 in 1970.
Geography
Mount Vernon is located within the Cumberland Plateau region of the state along Interstate 75 and U.S. Routes 25 and 150. I-75 runs to the east of the city, with access from exits 59 and 62. Via I-75, Lexington is 55 mi (89 km) north, and Knoxville, Tennessee is 119 mi (192 km) south. U.S. 25 meets U.S. 150 in the center of town, with U.S. 25 leading north 17 mi (27 km) to Berea and southeast 9 mi (14 km) to Livingston, and U.S. 150 leading northwest 25 mi (40 km) to Stanford.
According to the United States Census Bureau, the city has a total area of 3.7 square miles (9.6 km2), of which 3.2 square miles (8.3 km2) is land and 0.5 square miles (1.3 km2) (14.56%) is water.
Climate
| Climate data for Mount Vernon, Kentucky (1991–2020 normals, extremes 1956–2016) | |||||||||||||
|---|---|---|---|---|---|---|---|---|---|---|---|---|---|
| Month | Jan | Feb | Mar | Apr | May | Jun | Jul | Aug | Sep | Oct | Nov | Dec | Year |
| Record high °F (°C) | 76 (24) |
79 (26) |
86 (30) |
91 (33) |
91 (33) |
101 (38) |
102 (39) |
102 (39) |
97 (36) |
91 (33) |
82 (28) |
78 (26) |
102 (39) |
| Mean maximum °F (°C) | 64.8 (18.2) |
69.6 (20.9) |
77.0 (25.0) |
83.8 (28.8) |
85.9 (29.9) |
90.2 (32.3) |
92.1 (33.4) |
93.0 (33.9) |
90.1 (32.3) |
83.3 (28.5) |
75.8 (24.3) |
65.5 (18.6) |
93.9 (34.4) |
| Mean daily maximum °F (°C) | 42.3 (5.7) |
46.6 (8.1) |
55.6 (13.1) |
67.0 (19.4) |
74.5 (23.6) |
81.5 (27.5) |
84.4 (29.1) |
84.2 (29.0) |
79.3 (26.3) |
68.5 (20.3) |
56.1 (13.4) |
46.3 (7.9) |
65.5 (18.6) |
| Daily mean °F (°C) | 33.4 (0.8) |
37.0 (2.8) |
45.1 (7.3) |
55.4 (13.0) |
64.1 (17.8) |
71.7 (22.1) |
75.2 (24.0) |
74.1 (23.4) |
67.9 (19.9) |
56.6 (13.7) |
45.6 (7.6) |
37.6 (3.1) |
55.3 (12.9) |
| Mean daily minimum °F (°C) | 24.5 (−4.2) |
27.3 (−2.6) |
34.6 (1.4) |
43.8 (6.6) |
53.7 (12.1) |
62.0 (16.7) |
66.0 (18.9) |
63.9 (17.7) |
56.6 (13.7) |
44.8 (7.1) |
35.0 (1.7) |
29.0 (−1.7) |
45.1 (7.3) |
| Mean minimum °F (°C) | 1.1 (−17.2) |
7.1 (−13.8) |
16.5 (−8.6) |
26.1 (−3.3) |
36.0 (2.2) |
47.5 (8.6) |
53.4 (11.9) |
52.1 (11.2) |
40.1 (4.5) |
28.5 (−1.9) |
19.4 (−7.0) |
7.8 (−13.4) |
−1.7 (−18.7) |
| Record low °F (°C) | −24 (−31) |
−17 (−27) |
−8 (−22) |
17 (−8) |
27 (−3) |
36 (2) |
45 (7) |
38 (3) |
33 (1) |
19 (−7) |
6 (−14) |
−16 (−27) |
−24 (−31) |
| Average precipitation inches (mm) | 4.22 (107) |
4.02 (102) |
4.86 (123) |
4.79 (122) |
4.86 (123) |
4.79 (122) |
4.59 (117) |
3.65 (93) |
3.54 (90) |
3.59 (91) |
3.50 (89) |
4.94 (125) |
51.35 (1,304) |
| Average snowfall inches (cm) | 3.1 (7.9) |
4.0 (10) |
2.0 (5.1) |
0.0 (0.0) |
0.0 (0.0) |
0.0 (0.0) |
0.0 (0.0) |
0.0 (0.0) |
0.0 (0.0) |
0.0 (0.0) |
0.2 (0.51) |
1.6 (4.1) |
10.9 (28) |
| Average precipitation days (≥ 0.01 in) | 12.4 | 10.2 | 12.6 | 11.8 | 12.6 | 11.2 | 11.7 | 8.8 | 8.2 | 8.7 | 10.0 | 12.8 | 131.0 |
| Average snowy days (≥ 0.1 in) | 2.1 | 2.1 | 1.0 | 0.0 | 0.0 | 0.0 | 0.0 | 0.0 | 0.0 | 0.0 | 0.2 | 1.2 | 6.6 |
| Source: NOAA (mean maxima/minima 1981–2010)[6][7] | |||||||||||||
Demographics
| Census | Pop. | Note | %± |
|---|---|---|---|
| 1830 | 142 | — | |
| 1840 | 209 | 47.2% | |
| 1860 | 156 | — | |
| 1870 | 252 | 61.5% | |
| 1880 | 90 | −64.3% | |
| 1900 | 422 | — | |
| 1910 | 930 | 120.4% | |
| 1920 | 719 | −22.7% | |
| 1930 | 939 | 30.6% | |
| 1940 | 1,100 | 17.1% | |
| 1950 | 1,106 | 0.5% | |
| 1960 | 1,177 | 6.4% | |
| 1970 | 1,639 | 39.3% | |
| 1980 | 2,334 | 42.4% | |
| 1990 | 2,654 | 13.7% | |
| 2000 | 2,592 | −2.3% | |
| 2010 | 2,477 | −4.4% | |
| 2020 | 2,453 | −1.0% | |
| 2022 (est.) | 2,472 | [8] | 0.8% |
| U.S. Decennial Census[9] | |||
As of the census[10] of 2000, there were 2,592 people, 1,126 households, and 681 families residing in the city. The population density was 816.2 inhabitants per square mile (315.1/km2). There were 1,241 housing units at an average density of 390.8 per square mile (150.9/km2). The racial makeup of the city was 98.46% White, 0.66% African American, 0.15% Native American, 0.15% Asian, 0.00% Pacific Islander, 0.04% from other races, and 0.54% from two or more races. 0.39% of the population were Hispanic or Latino of any race.
There were 1,126 households, out of which 28.1% had children under the age of 18 living with them, 40.2% were married couples living together, 17.3% had a female householder with no husband present, and 39.5% were non-families. 37.4% of all households were made up of individuals, and 18.0% had someone living alone who was 65 years of age or older. The average household size was 2.15 and the average family size was 2.82.
In the city, the population was spread out, with 21.9% under the age of 18, 9.8% from 18 to 24, 26.5% from 25 to 44, 23.6% from 45 to 64, and 18.2% who were 65 years of age or older. The median age was 38 years. For every 100 females, there were 86.6 males. For every 100 females age 18 and over, there were 82.3 males.
The median income for a household in the city was $16,747, and the median income for a family was $23,105. The per capita income for the city was $11,849. About 26.5% of families and 33.8% of the population were below the poverty line, including 41.4% of those under age 18 and 26.8% of those age 65 or over.
Education
Mount Vernon has a lending library, the Rockcastle County Public Library.[11]
Notable people
- Lori Stewart Gonzalez (born 1957), speech pathologist and academic administrator
See also
References
- ^ a b Commonwealth of Kentucky. Office of the Secretary of State. Land Office. "Mount Vernon, Kentucky". Accessed 26 August 2013.
- ^ "2020 U.S. Gazetteer Files". United States Census Bureau. Retrieved March 18, 2022.
- ^ a b U.S. Geological Survey Geographic Names Information System: Mount Vernon, Kentucky
- ^ "Annual Estimates of the Resident Population for Incorporated Places in Kentucky: April 1, 2020 to July 1, 2022". United States Census Bureau. Retrieved May 26, 2023.
- ^ "Summary and Reference Guide to House Bill 331 City Classification Reform" (PDF). Kentucky League of Cities. Retrieved December 30, 2014.
- ^ "NOWData – NOAA Online Weather Data". National Oceanic and Atmospheric Administration. Retrieved November 18, 2023.
- ^ "Summary of Monthly Normals 1991–2020". National Oceanic and Atmospheric Administration. Retrieved November 18, 2023.
- ^ "Annual Estimates of the Resident Population for Incorporated Places in Kentucky: April 1, 2020 to July 1, 2022". United States Census Bureau. Retrieved May 26, 2023.
- ^ "Census of Population and Housing". Census.gov. Retrieved June 4, 2015.
- ^ "U.S. Census website". United States Census Bureau. Retrieved January 31, 2008.
- ^ "Kentucky Public Library Directory". Kentucky Department for Libraries and Archives. Archived from the original on January 11, 2019. Retrieved June 7, 2019.
External links
Municipalities and communities of Rockcastle County, Kentucky, United States | ||
|---|---|---|
| Cities | 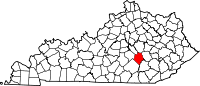 | |
| Unincorporated communities | ||
| Geographic | |
|---|---|
| Other | |