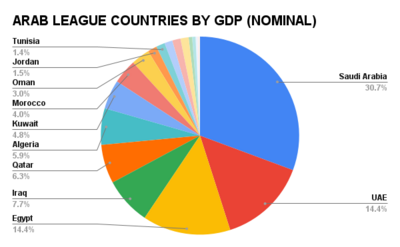
List of Arab League countries by GDP (nominal)
Appearance
This article lists the countries of the Arab League sorted by their gross domestic product (GDP) at nominal values. GDP is the value of all final goods and services produced within a nation in a given year. The table below shows the nominal GDP and GDP per capita for the 22 Members of the Arab League in 2024. The figures shown are estimates compiled by the International Monetary Fund's World Economic Outlook[1]

List
| Rank | Country/Territory | 2024 GDP (US$ billions) [1] | 2024 GDP per capita (US$) [1] |
|---|---|---|---|
| — | 125,064.915” | 13,900” | |
| — | 3,575.705 [n 1] | 7,689 | |
| 01. | 1,100.706 | 32,881 | |
| 02. | 545.053 | 49,550 | |
| 03. | 380.044 | 3,542 | |
| 04. | 264.149 | 5,947 | |
| 05. | 260.134 | 5,579 | |
| 06. | 221.406 | 71,568 | |
| 07. | 161.822 | 32,290 | |
| 08. | 157.087 | 4,204 | |
| 09. | 109.993 | 20,631 | |
| 10. | 60.043 (2010) | 2,807 (2010) | |
| 11. | 53.305 | 4,682 | |
| 12. | 52.636 | 4,267 | |
| 13. | 47.812 | 29,573 | |
| 14. | 44.812 | 6,482 | |
| 15. | 29.793 | 606 | |
| 16. | 24.023 (2023) | 4,487 (2023) | |
| 18. | 17.421 (2023) | 3,181 (2023; Est.) | |
| 17. | 10.761 | 2,376 (2024; Est.) | |
| 19. | 16.192 | 465 (2025; Est.) |
See also
Notes
- ^ The sum of all GDP figures below.
References
- ^ a b c "Report for Selected Countries and Subjects". IMF. Retrieved 26 October 2024.
