This is not an encyclopedia article. If you find this page on any site other than Wikipedia, you are viewing a mirror site. Be aware that the page may be outdated and that the user this page belongs to may have no personal affiliation with any site other than Wikipedia itself. The original page is located at [automatically-generated http://en.wikipedia.org/wiki/User:YourName link].
Many forms of Government have been tried, and will be tried in this world of sin and woe. No one pretends that democracy is perfect or all-wise. Indeed, it has been said that democracy is the worst form of government except all those other forms that have been tried from time to time.
Sir Winston Churchill
The death of democracy is not likely to be an assassination from ambush. It will be a slow extinction from apathy, indifference, and undernourishment.
However, there are of course many opposing arguments and I have tried to include the views of both sides in order to achieve NPOV. I believe that the capitalist system must include policies redistributing wealth from the most wealthy, since it is easier for the already wealthy to gradually accumulate more wealth than it is for the poor to gain any wealth. Therefore, relatively high progressive taxation, wealth tax, and/or inheritance tax.
The percentage of the world's population living on less than $1 per day (black line). Graph shows the years 1981-2001.
Life expectancy has been increasing and converging for most of the world. Sub-Saharan Africa has recently seen a decline, partly related to the AIDS epidemic. Graph shows the years 1950-2005.
Number of nations 1800-2003 scoring 8 or higher on the Polity IV scale, a measure of democracy. Graph shows the years 1800-2003.
World map of the Ease of Doing Business Index. Green nations rank higher, red nations lower. Each color represent one quartile of the ranked nations.
World map of the 2006-2007 Global Competitiveness Index. Each color represent one quartile of the ranked nations. Green nations score higher, red nations lower. Grey nations are not ranked.
World map of the Corruption Perceptions Index, which measures "the degree to which corruption is perceived to exist among public officials and politicians"

 The percentage of the world's population living on less than $1 per day (black line). Graph shows the years 1981-2001.
 Life expectancy has been increasing and converging for most of the world. Sub-Saharan Africa has recently seen a decline, partly related to the AIDS epidemic. Graph shows the years 1950-2005.
 Number of nations 1800-2003 scoring 8 or higher on the Polity IV scale, a measure of democracy. Graph shows the years 1800-2003.
 Freedom House Country Rankings 1972-2005
 World GDP/capita 1-2003 AD.
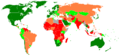 World map of the Ease of Doing Business Index. Green nations rank higher, red nations lower. Each color represent one quartile of the ranked nations.
 World map of the 2006-2007 Global Competitiveness Index. Each color represent one quartile of the ranked nations. Green nations score higher, red nations lower. Grey nations are not ranked.
 World map of the Corruption Perceptions Index, which measures "the degree to which corruption is perceived to exist among public officials and politicians"
 Charts showing Economic freedom and various other indicators.
 Food production per person 1961-2005


 Freedom House scores nations on political freedom.
 Green = Happiest > Blue > Purple > Orange > Red = Least Happy; Grey = Data not available
