
Amt Ortrand
(Redirected from Ortrand (Amt))

Amt Ortrand is an Amt ("collective municipality") in the district of Oberspreewald-Lausitz, in Brandenburg, Germany. Its seat is in Ortrand.
The Amt Ortrand consists of the following municipalities:
Demography
-
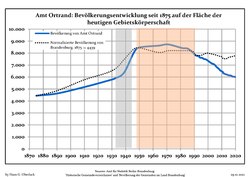 Development of Population since 1875 within the Current Boundaries (Blue Line: Population; Dotted Line: Comparison to Population Development of Brandenburg state; Grey Background: Time of Nazi rule; Red Background: Time of Communist rule)
 -
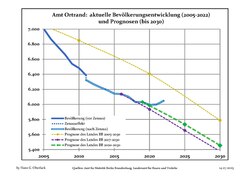 Recent Population Development and Projections (Population Development before Census 2011 (blue line); Recent Population Development according to the Census in Germany in 2011 (blue bordered line); Official projections for 2005-2030 (yellow line); for 2017-2030 (scarlet line); for 2020-2030 (green line)


|
|
|
References
- ^ Detailed data sources are to be found in the Wikimedia Commons.Population Projection Brandenburg at Wikimedia Commons
| Barnim | |
|---|---|
| Dahme-Spreewald | |
| Elbe-Elster | |
| Havelland | |
| Märkisch-Oderland | |
| Oberhavel | |
| Oberspreewald-Lausitz | |
| Oder-Spree | |
| Ostprignitz-Ruppin | |
| Potsdam-Mittelmark | |
| Prignitz | |
| Spree-Neiße | |
| Teltow-Fläming | |
| Uckermark | |
51°22′35″N 13°45′27″E / 51.376306°N 13.757611°E
This Brandenburg location article is a stub. You can help Wikipedia by expanding it. |