
File:Shifts in Recovery Curves.png
Size of this preview: 726 × 600 pixels. Other resolutions: 291 × 240 pixels | 581 × 480 pixels | 914 × 755 pixels.
Original file (914 × 755 pixels, file size: 103 KB, MIME type: image/png)
Summary
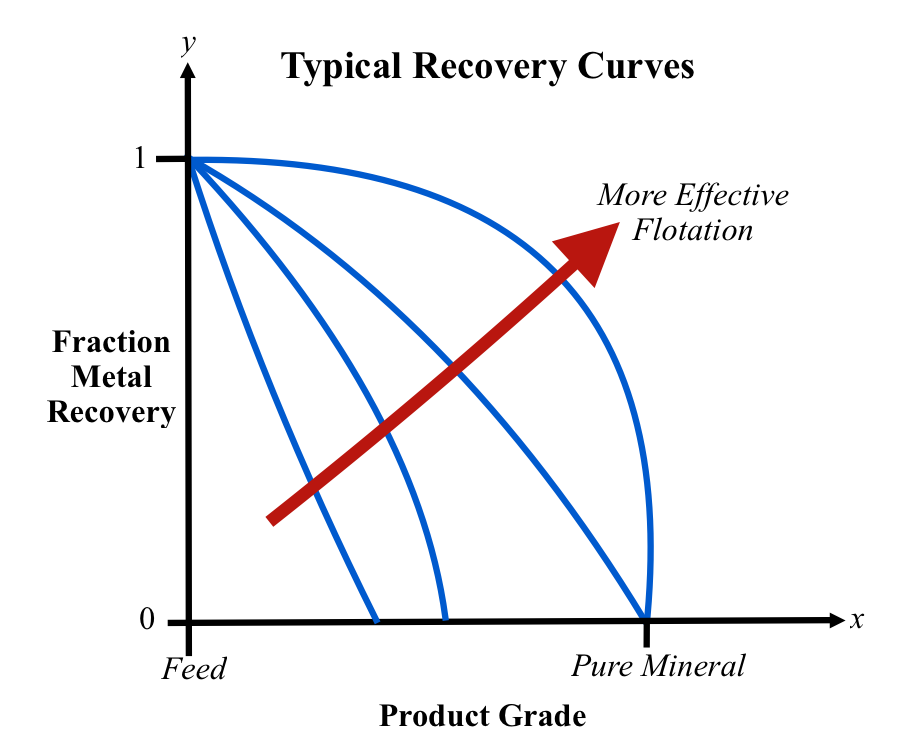
| Description |
Example of possible grade-recovery curves seen in froth floatation processes. Shifts in the curves indicate changes in flotation effectiveness. |
|---|---|
| Source |
I created this diagram using Microsoft Office |
| Date |
2015-06-07 |
| Author | |
| Permission (Reusing this file) |
See below.
|
Licensing
I, the copyright holder of this work, hereby publish it under the following licenses:
 | Permission is granted to copy, distribute and/or modify this document under the terms of the GNU Free Documentation License, Version 1.2 or any later version published by the Free Software Foundation; with no Invariant Sections, no Front-Cover Texts, and no Back-Cover Texts. |
| This work is licensed under the Creative Commons Attribution-ShareAlike 3.0 License. |
You may select the license of your choice.
File history
Click on a date/time to view the file as it appeared at that time.
| Date/Time | Thumbnail | Dimensions | User | Comment | |
|---|---|---|---|---|---|
| current | 06:23, 8 June 2015 | | 914 × 755 (103 KB) | Jerowewiki (talk | contribs) | Uploading a self-made file using File Upload Wizard |
You cannot overwrite this file.
File usage
The following 2 pages use this file: