
Search results
There is a page named "File:Hubbert curve.svg" on Wikipedia
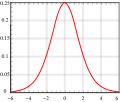 DescriptionHubbert curve.svg English: Plot of the Hubbert curve. Date 19 April 2015 Source Own work Author Rubber Duck (☮ • ✍) SVG development InfoField...(512 × 435 (2 KB)) - 01:20, 8 November 2023
 December 2003 . . Populus . . 320x240 (2235 bytes) (corrected version of hubbert curve generated using gnuplot with options set nokey; set grid; set size 0...(320 × 240 (1 KB)) - 09:12, 2 November 2021
 Illustration of Hubbert Theory with Norway's production. This graphic is made under matlab and converted into SVG format using Juerg Schwizer's remarkable...(512 × 387 (24 KB)) - 12:36, 26 January 2024
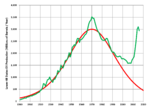 Hubbert's curve is taken from M. King Hubbert (1956), using his upper-bound estimated ultimate recovery of 200 billion barrels. Actual lower-48 state...(1,950 × 1,425 (36 KB)) - 05:57, 28 October 2020
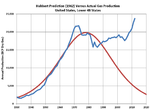 The curve is from the equation and figures in: M. King Hubbert, 1962, "Energy Resources," National Academy of Sciences, Publication 1000-D, p.81-83. I...(1,850 × 1,350 (32 KB)) - 08:19, 28 October 2020
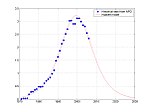 Production of Norway: historical figures (brown squares) compared with a Hubbert curve calculated with a total production of 32 billion barrels, peak in the...(1,201 × 900 (81 KB)) - 18:50, 6 December 2022
 term svg set output "norwayoilproductionandHubbert2013.svg" plot [1970:2015] "./keingas" title "combined production", bell(x) title "Hubbert curve" Datasource:...(600 × 480 (13 KB)) - 18:50, 6 December 2022
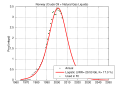 DescriptionHubbert Norway.svg Oil production for Norway and Hubbert curve estimated using the Hubbert Linearization. Data from the BP. Date 7 March 2007...(512 × 384 (24 KB)) - 06:34, 31 October 2020
 DescriptionHubbert US Lower48.svg US Lower-48 crude oil production and Hubbert curve. Date 7 March 2007 Source Own work Author S. Foucher (Sfoucher)...(512 × 384 (38 KB)) - 06:34, 31 October 2020


