
Search results
There is a page named "File:Foreclosure trend - 2007.svg" on Wikipedia
 "Q1\n2008","Q2\n2008") foreclosures<-c(239770,333627,446726,527740,649917,739714) pdf('foreclosures.pdf', width=5, height=6) barplot(foreclosures/1000, ylab="1...(395 × 407 (15 KB)) - 23:37, 1 October 2020
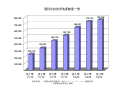 some properties that appeared in multiple quarters because they had foreclosure activity against them in more than one quarter." RealtyTrac includes...(960 × 720 (31 KB)) - 02:46, 5 October 2020

