File:2016 Presidential Election by County - Trump.svg
Page contents not supported in other languages.
This is a file from the Wikimedia Commons
Source: Wikipedia, the free encyclopedia.

Original file (SVG file, nominally 990 × 627 pixels, file size: 939 KB)

Summary

Description
English: 2016 Presidential Election by County - Trump.
 
Trump—0–10%
 
Trump—10–20%
 
Trump—20–30%
 
Trump—30–40%
 
Trump—40–50%
 
Trump—50–60%
 
Trump—60–70%
 
Trump—70–80%
 
Trump—80–90%
 
Trump—>90%
Date
Source This file was derived from: USA Counties.svg
Author Ali Zifan
Other versions

[edit]

United States presidential election maps, 2016
  • Results by state, shaded according to winning candidate's percentage of the vote
    Results by state, shaded according to winning candidate's percentage of the vote
  • Results by Vote Distribution Among States. Each state's pie chart is proportional to the number of electoral votes they have.
    Results by Vote Distribution Among States. Each state's pie chart is proportional to the number of electoral votes they have.
  • Results by county. Red denotes counties that went to Trump; blue denotes counties that went to Clinton.
    Results by county. Red denotes counties that went to Trump; blue denotes counties that went to Clinton.
  • Results by county, shaded according to winning candidate's percentage of the vote.
    Results by county, shaded according to winning candidate's percentage of the vote.
  • United States presidential election, 2016 Cartogram
    United States presidential election, 2016 Cartogram
  • Electoral vote cartogram
    Electoral vote cartogram
  • Results by state, shaded according to percentage of the vote for Trump
    Results by state, shaded according to percentage of the vote for Trump
  • Results by state, shaded according to percentage of the vote for Clinton
    Results by state, shaded according to percentage of the vote for Clinton
  • Results by county, shaded according to percentage of the vote for Trump
    Results by county, shaded according to percentage of the vote for Trump
  • Results by county, shaded according to percentage of the vote for Clinton
    Results by county, shaded according to percentage of the vote for Clinton
  • Results by county, shaded according to percentage of the vote for Johnson
    Results by county, shaded according to percentage of the vote for Johnson
  • Results by county, shaded according to percentage of the vote for Stein
    Results by county, shaded according to percentage of the vote for Stein
  • Results by county, shaded according to winning candidate's percentage of the vote (Red-Purple-Blue view)
    Results by county, shaded according to winning candidate's percentage of the vote (Red-Purple-Blue view)
  • Results of 2016 U.S. presidential election by congressional district, shaded by vote margin.
    Results of 2016 U.S. presidential election by congressional district, shaded by vote margin.
  • County swing from 2012 to 2016
    County swing from 2012 to 2016
Results (States by county)
  • Alabama
    Alabama
  • Alaska
    Alaska
  • Arizona
    Arizona
  • Arkansas
    Arkansas
  • California
    California
  • Colorado
    Colorado
  • Connecticut
    Connecticut
  • Delaware
    Delaware
  • District of Columbia
    District of Columbia
  • Florida
    Florida
  • Georgia
    Georgia
  • Hawaii
    Hawaii
  • Idaho
    Idaho
  • Illinois
    Illinois
  • Indiana
    Indiana
  • Iowa
    Iowa
  • Kansas
    Kansas
  • Kentucky
    Kentucky
  • Louisiana
    Louisiana
  • Maine
    Maine
  • Maryland
    Maryland
  • Massachusetts
    Massachusetts
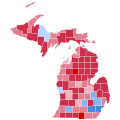
  • Michigan
    Michigan
  • Minnesota
    Minnesota
  • Mississippi
    Mississippi
  • Missouri
    Missouri
  • Montana
    Montana
  • Nebraska
    Nebraska
  • Nevada
    Nevada
  • New Hampshire
    New Hampshire
  • New Jersey
    New Jersey
  • New Mexcio
    New Mexcio
  • New York
    New York
  • North Carolina
    North Carolina
  • North Dakota
    North Dakota
  • Ohio
    Ohio
  • Oklahoma
    Oklahoma
  • Oregon
    Oregon
  • Pennsylvania
    Pennsylvania
  • Rhode Island
    Rhode Island
  • South Carolina
    South Carolina
  • South Dakota
    South Dakota
  • Tennessee
    Tennessee
  • Texas
    Texas
  • Utah
    Utah
  • Vermont
    Vermont
  • Virginia
    Virginia
  • Washington
    Washington
  • West Virginia
    West Virginia
  • Wisconsin
    Wisconsin
  • Wyoming
    Wyoming

Licensing

I, the copyright holder of this work, hereby publish it under the following license:
w:en:Creative Commons
attribution share alike
This file is licensed under the Creative Commons Attribution-Share Alike 4.0 International license.
You are free:
  • to share – to copy, distribute and transmit the work
  • to remix – to adapt the work
Under the following conditions:
  • attribution – You must give appropriate credit, provide a link to the license, and indicate if changes were made. You may do so in any reasonable manner, but not in any way that suggests the licensor endorses you or your use.
  • share alike – If you remix, transform, or build upon the material, you must distribute your contributions under the same or compatible license as the original.

Captions

Add a one-line explanation of what this file represents

Items portrayed in this file

depicts

11 November 2016

image/svg+xml

8ef1b1b7c8a67b8968d4aa28c0391dd87bd19cf2

961,694 byte

627 pixel

990 pixel

File history

Click on a date/time to view the file as it appeared at that time.

Date/TimeThumbnailDimensionsUserComment
current04:32, 4 January 2017Thumbnail for version as of 04:32, 4 January 2017990 × 627 (939 KB)Oganesson007update many counties
21:58, 15 December 2016Thumbnail for version as of 21:58, 15 December 2016990 × 627 (1.03 MB)WikiBunny2K1Updated Alaska
05:23, 11 November 2016Thumbnail for version as of 05:23, 11 November 2016990 × 627 (955 KB)Oganesson007User created page with UploadWizard
No pages on the English Wikipedia use this file (pages on other projects are not listed).

Global file usage

Metadata