
Timeline of the 1972 Atlantic hurricane season
| Timeline of the 1972 Atlantic hurricane season | |||||
|---|---|---|---|---|---|
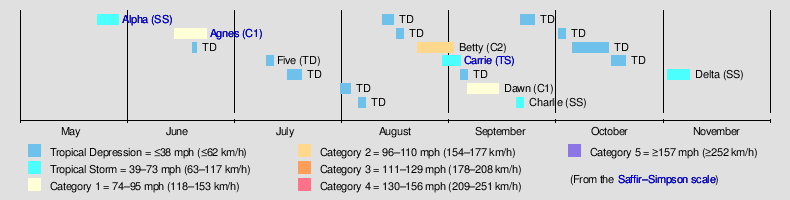
 Season summary map | |||||
| Season boundaries | |||||
| First system formed | May 23, 1972 | ||||
| Last system dissipated | November 7, 1972 | ||||
| Strongest system | |||||
| Name | Betty (Bravo) | ||||
| Maximum winds | 105 mph (165 km/h) (1-minute sustained) | ||||
| Lowest pressure | 976 mbar (hPa; 28.82 inHg) | ||||
| Longest lasting system | |||||
| Name | Betty (Bravo) | ||||
| Duration | 10 days | ||||
| |||||
The 1972 Atlantic hurricane season was a cycle of the annual tropical cyclone season in the Atlantic Ocean in the Northern Hemisphere. It was a significantly below average season,[nb 1] having only four fully tropical named storms, the fewest since 1930.[2] It was one of only five Atlantic hurricane seasons since 1944 to have no major hurricanes,[nb 2] the others being 1968, 1986, 1994, and 2013. The season officially began on June 1, 1972 and ended on November 30, 1972. These dates, adopted by convention, historically describe the period in each year when most tropical systems form.[4] However, storm formation is possible at any time of the year, as demonstrated in 1972 by the formation of Subtropical Storm Alpha on May 23. The season's final storm, Subtropical Storm Delta, dissipated on November 7.
The season produced nineteen tropical or subtropical cyclones, of which seven intensified into tropical or subtropical storms; three became hurricanes, of which only but only one, Betty, had sustained winds greater than minimum hurricane force. Despite its relative inactivity, the 1972 season resulted in one of the worst natural disasters in American history, Hurricane Agnes. Agnes was a weak but large storm that initially made landfall on the Florida Panhandle before moving up the eastern United States. The hurricane killed 122 people and caused $2.1 billion (1972 USD) in damage, mostly due to flooding in Pennsylvania and New York.[2]
This timeline documents tropical cyclone formations, strengthening, weakening, landfalls, extratropical transitions, and dissipations during the season. It includes information that was not released throughout the season, meaning that data from post-storm reviews by the National Hurricane Center, such as a storm that was not initially warned upon, has been included.
By convention, meteorologists use one time zone when issuing forecasts and making observations: Coordinated Universal Time (UTC), and also use the 24-hour clock (where 00:00 = midnight UTC).[5] In this time line, all information is listed by UTC first with the respective local time included in parentheses.
Timeline
May

May 23
- 18:00 UTC (2:00 p.m. EDT) – A subtropical depression forms while located about 285 km (175 mi) to the southeast of Savannah, Georgia.[6]
May 26
- 00:00 UTC (8:00 p.m. EDT May 25) – The subtropical depression previously located to the southeast of Savannah, Georgia, is classified as a subtropical storm after it develops gale force winds.[2][6]
May 26
- 12:00 UTC (8:00 a.m. EDT) – The subtropical storm attains its peak intensity, with maximum sustained wind speeds of 70 mph (115 km/h).[6]
- 16:00 UTC (12:00 p.m. EDT) – The National Hurricane Center (NHC) initiates advisories on the system, which is named Subtropical Storm Alpha.[7]
May 28
- 00:00 UTC (8:00 p.m. EDT, May 27) – Subtropical Storm Alpha weakens into a subtropical depression, after it makes landfall near Brunswick, Georgia.[2][6]
- 02:00 UTC (10:00 p.m. EDT, May 27) – The final advisory on Subtropical Depression Alpha as it moves into Florida.[8]
- 12:00 UTC (8:00 a.m. EDT) – Subtropical Depression Alpha emerges into the Gulf of Mexico, with winds of 35 mph (55 km/h).[6]
May 29
- 12:00 UTC (8:00 a.m. EDT) – Subtropical Depression Alpha is last noted in the Gulf of Mexico, before it dissipates later that day.[6]
June
June 1
- The 1972 Atlantic hurricane season officially begins.[4]

June 14
- 12:00 UTC (7:00 a.m. CDT) – A tropical depression forms over the Yucatan Peninsula.[9][10]
June 15
- 18:00 UTC (1:00 p.m. CDT) – The tropical depression emerges off the Yucatan Peninsula into the western Caribbean Sea with winds of 35 mph (55 km/h).[9][10]
June 16
June 18
- 12:00 UTC (7:00 a.m. CDT) – Tropical Storm Agnes strengthens into the first hurricane of the season.[9][10]
June 19
- 06:00 UTC (1:00 a.m. CDT) – Hurricane Agnes attains its peak intensity, with maximum sustained winds of 85 mph (135 km/h).[9][10]

- 18:00 UTC (1:00 p.m. CDT) – Hurricane Agnes makes landfall near Panama City, Florida with winds of 85 mph (135 km/h).[9][10]
June 20
- 00:00 UTC (7:00 p.m CDT, June 19) – Hurricane Agnes weakens into a tropical storm.[9][10]
- 06:00 UTC (1:00 a.m. CDT) – Tropical Storm Agnes rapidly weakens into a tropical depression.[9][10]
June 21
- 18:00 UTC (2:00 p.m. EDT) – Tropical Depression Agnes unexpectedly re-strengthens into a tropical storm while over eastern North Carolina.[9][10]
June 22
- 00:00 UTC (8:00 p.m. EDT, June 21) – Tropical Storm Agnes emerges into the Atlantic Ocean near Nags Head, North Carolina.[9][10]
- 12:00 UTC (8:00 a.m. EDT) – Tropical Storm Agnes reaches its secondary peak intensity, with maximum winds of 70 mph (115 km/h).[9][10]
- 18:00 UTC (1:00 p.m. EDT) – Tropical Storm Agnes makes landfall near New York City, New York with winds of 65 mph (105 km/h).[9][10]
June 23
- 04:00 UTC, (12:00 a.m. EDT) – The NHC issues its final advisory on Tropical Storm Agnes, after the system is absorbed by a developing extratropical cyclone over north-eastern Pennsylvania.[2][11]
July
- No tropical cyclones form in the Atlantic Ocean during the month of July.
August

August 22
August 24
- 00:00 UTC (9:00 p.m. ADT, August 23) – The subtropical depression strengthens into a Subtropical Storm Bravo.[12][13]
August 25
August 27
- 12:00 UTC (9:00 a.m. ADT) – Tropical Storm Betty strengthens into the second hurricane of the season.[12][13]
- 18:00 UTC (3:00 p.m. ADT) – Hurricane Betty strengthens into a category 2 hurricane.[12][13]
August 28
- 00:00 UTC (9:00 p.m. ADT, August 27) – Hurricane Betty reaches its peak intensity, with maximum winds of 105 mph (170 km/h).[12][13]
August 29
- 12:00 UTC (8:00 a.m. EDT) – A tropical depression forms to the west of Daytona Beach, Florida.[14][15]
- 18:00 UTC (3:00 p.m. ADT) – Hurricane Betty weakens into a category 1 hurricane.[12][13]

August 31
- 00:00 UTC (8:00 p.m. EDT, August 30) – The tropical depression strengthens into a Tropical Storm Carrie.[14][15]
August 31
- 00:00 UTC (9:00 p.m. ADT, August 30) – Hurricane Betty weakens into a tropical storm.[12][13]
- 18:00 UTC (2:00 p.m. EDT) – Tropical Storm Carrie reaches its initial peak intensity, with maximum sustained winds of 60 mph (95 km/h).[14][15]
September
September 1
- 18:00 UTC (3:00 p.m. ADT) – Tropical Storm Betty becomes extratropical in the frigid waters of the North Atlantic.[12][13]
September 3
- 18:00 UTC (2:00 p.m. EDT) – Tropical Storm Carrie attains its peak strength, with maximum sustained wind speeds of 70 mph (115 km/h).[14][15]

September 4
September 5
- 00:00 UTC (8:00 p.m. EDT, September 4) – A tropical depression forms northeast of Santa Clara, Cuba.[6]
- 18:00 UTC (2:00 p.m. EDT) – The tropical depression makes landfall on Key Largo, Florida with winds of 35 mph (55 km/h).[6]
September 6
- 00:00 UTC (8:00 p.m. EDT, September 5) – The tropical depression emerges off the Floridian coast into the North Atlantic.[6]
- 12:00 UTC (8:00 a.m. EDT) – The tropical depression strengthens into Tropical Storm Dawn.[6]
September 7
- 18:00 UTC (2:00 p.m. EDT) – Tropical Storm Dawn strengthens into the third and final hurricane of the season.[6]
September 8
- 00:00 UTC (8:00 p.m. EDT, September 7) – Hurricane Dawn attains its peak intensity, with maximum sustained winds of 80 mph (130 km/h).[6]
September 9
- 00:00 UTC (8:00 p.m. EDT, September 8) – Hurricane Dawn weakens into a tropical storm.[6]
September 12
- 18:00 UTC (2:00 p.m. EDT) – Tropical Storm Dawn weakens into a tropical depression.[6]
September 14
- 12:00 UTC (8:00 a.m. EDT) – Tropical Depression Dawn dissipates northeast of Charleston, South Carolina after having paralleled the Georgia and South Carolina coasts for the previous 24 hours.[6]

September 19
September 20
- 00:00 UTC (9:00 p.m. ADT, September 19) – The subtropical depression strengthens into Subtropical Storm Charlie.[6]
September 21
- 00:00 UTC (9:00 p.m. ADT, September 20) – Subtropical Storm Charlie reaches its peak intensity, with maximum sustained winds of 65 mph (105 km/h).[6]
September 21
- 06:00 UTC (3:00 a.m. ADT) – Subtropical Storm Charlie becomes extratropical.[6]
October
- No tropical cyclones form in the Atlantic Ocean during the month of October.
November

November 1
- 3:00 p.m. ADT (18:00 UTC (3:00 p.m. ADT) – A subtropical depression forms in the central North Atlantic.[6]
November 2
- 00:00 UTC (9:00 p.m. ADT, November 1) – The subtropical depression strengthens into Subtropical Storm Delta.[6]
- 12:00 UTC (9:00 a.m. ADT) – Subtropical Storm Delta reaches its peak strength, with maximum sustained winds of 45 mph (70 km/h).[6]
November 5
- 00:00 UTC (9:00 p.m. ADT, November 4) – Subtropical Storm Delta weakens into a subtropical depression.[6]
November 7
- 18:00 UTC (3:00 p.m. ADT) – Subtropical Depression Delta is last noted, before it dissipates well to the south-west of the Azores later that day.[2][6]
November 30
- The 1972 Atlantic hurricane season officially ends.[4]
See also
Notes
- ^ An average Atlantic hurricane season, as defined by the National Oceanic and Atmospheric Administration, has 12 tropical storms, six hurricanes and two major hurricanes.[1]
- ^ Hurricanes reaching Category 3 and higher on the Saffir–Simpson scale are considered major hurricanes.[3]
References
- ^ "Background Information: North Atlantic Hurricane Season". College Park, Maryland: NOAA Climate Prediction Center. Archived from the original on May 1, 2021. Retrieved July 11, 2020.
- ^ a b c d e f Simpson, R. H.; Herbert, Paul J. (April 1973). "Atlantic Hurricane Season of 1972" (PDF). Monthly Weather Review. 101 (4). American Meteorological Society: 323–332. Bibcode:1973MWRv..101..323S. doi:10.1175/1520-0493(1973)101<0323:AHSO>2.3.CO;2. Archived (PDF) from the original on July 13, 2020. Retrieved July 13, 2020 – via www.aoml.noaa.gov.
- ^ "Saffir-Simpson Hurricane Wind Scale". nhc.noaa.gov. Miami Florida: NOAA National Hurricane Center. Archived from the original on June 20, 2020. Retrieved July 13, 2020.
- ^ a b c Dorst, Neal (June 1, 2018). "Hurricane Season Information". Frequently Asked Questions About Hurricanes. Miami, Florida: NOAA Atlantic Oceanographic and Meteorological Laboratory. Archived from the original on September 17, 2021. Retrieved June 29, 2020.
- ^ "Understanding the Date/Time Stamps". miami, Florida: NOAA National Hurricane Center. Archived from the original on April 12, 2021. Retrieved July 10, 2020.
- ^ a b c d e f g h i j k l m n o p q r s t u v w x "Atlantic hurricane best track (HURDAT version 2)" (Database). United States National Hurricane Center. April 5, 2023. Retrieved April 9, 2024.
 This article incorporates text from this source, which is in the public domain.
- ^ "Subtropical Storm Alpha, Marine Bulletin 1". National Hurricane Center. 26 May 1972. Archived from the original on 21 February 2018. Retrieved 24 October 2016.
- ^ "Subtropical Storm Alpha, Subtropical Cyclone Bulletin 8". National Hurricane Center. 28 May 1972. Archived from the original on 8 July 2015. Retrieved 24 October 2016.
- ^ a b c d e f g h i j k l "Hurricane Agnes Best Track". Tropical Prediction Center. Archived from the original on 2013-01-23. Retrieved 2009-01-28.
- ^ a b c d e f g h i j k l "HURDAT Best Track for Hurricane Agnes". Atlantic Basin Hurricane Database. Archived from the original on 2012-02-14. Retrieved 2009-01-29.
- ^ "Archived copy". Archived from the original on 2016-10-03. Retrieved 2016-10-02.
{{cite web}}: CS1 maint: archived copy as title (link) - ^ a b c d e f g h i "Hurricane Betty Best Track". Tropical Prediction Center. Archived from the original on 2013-01-23. Retrieved 2009-01-28.
- ^ a b c d e f g h i "HURDAT Best Track for Hurricane Betty". Atlantic Basin Hurricane Database. Archived from the original on 2012-02-14. Retrieved 2009-01-29.
- ^ a b c d e "Tropical Storm Carrie Best Track". Tropical Prediction Center. Archived from the original on 2013-01-23. Retrieved 2009-01-28.
- ^ a b c d e "HURDAT Best Track for Tropical Storm Carrie". Atlantic Basin Hurricane Database. Archived from the original on 2012-02-14. Retrieved 2009-01-29.