
Solar power in California
This article's lead section may be too short to adequately summarize the key points. (December 2018) |


Solar power has been growing rapidly in the U.S. state of California because of high insolation, community support, declining solar costs, and a renewable portfolio standard which requires that 60% of California's electricity come from renewable resources by 2030, with 100% by 2045.[1] Much of this is expected to come from solar power via photovoltaic facilities or concentrated solar power facilities.
At the end of 2023, California had a total of 46,874 MW of solar capacity installed, enough to power 13.9 million homes in the state. California ranked as the highest solar power generating state in the nation, with solar power providing for 28% of the state's electricity generation.[2] 63% of solar generation was produced by utility-scale solar farms, with the other 37% produced by distributed generation.[3] The Solar Energy Industries Association predicts that California will increase its solar capacity by over 20,000 MW over the next five years, the second highest increase in solar capacity in the country behind Texas at 41,000 MW.[2]
The state government has created various programs to incentivize and subsidize solar installations, including an exemption from property tax, cash incentives, net metering, streamlined permitting for residential solar, and, in 2020, requiring all new homes have solar panels.
History

Over the last 20 years, California has been home to a number of the world's largest solar facilities, many of which are located in the Mojave Desert. In 1991, the 354 MW Solar Energy Generating Systems plant (located in San Bernardino County, California) held the title until being bested by the 392 MW Ivanpah Solar Electric Generating System, a solar thermal plant located in San Bernardino County near the Nevada border.
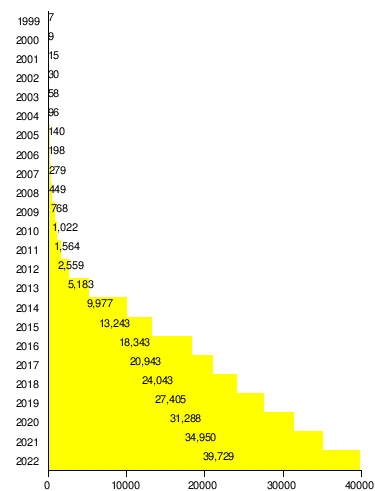
The early to mid 2010s saw the sharpest increase in solar development.[4] By the end of 2013, California had 490 MW of concentrated solar power and 5,183 MW of photovoltaics capacity in operation.[5]
In 2014, the 550 MW Topaz Solar Farm became the new "world's largest operational" solar facility and went online in San Luis Obispo County, California. A second 550 MW facility, Desert Sunlight Solar Farm, went online in Riverside County in 2014, constructed by First Solar. In June 2015, the 579 MW Solar Star facility went online, becoming the new largest operational solar facility and making California host to the three largest photovoltaic solar facilities in the world.[6] There are several proposals for even larger facilities seeking regulatory approval in California, such as the 2.7 GW Westlands Solar Park.
In 2014, California led the nation in the number of homes which have solar panels installed, totaling over 230,000.[7] Many were installed because of the Million Solar Roof Initiative.[8]
In December 2017, the Solar on Multifamily Affordable Housing (SOMAH) program was approved by the California Public Utilities Commission. The program plans to allocate one billion dollars from the state's greenhouse gas cap-and-trade program to incentivize owners of affordable, multi-family buildings to install solar, with a goal of adding 300 MW of capacity by 2030.[9]
In May 2018, the California Energy Commission (CEC) required that nearly all new homes (both single-family and multi-family) under four stories be built with rooftop photovoltaic solar panels .[10] Developers can also receive approval from the CEC to subscribe new homes to local community solar generation.[11] In early 2020, the Sacramento Municipal Utility District (SMUD) was approved to provide community solar to new homes in Sacramento.[12][13][14]

Solar systems with battery storage are now much more valuable than systems without battery storage, mostly because new solar generation exacerbates the duck curve (varying power supply from traditional power plants).[16] Solar production causes fossil-fuel power plants to be turned down to minimum during the day, but when solar production stops in the evening peaker plants must quickly ramp generation by 5GW an hour to supply peak demand.[17] New solar generation only displaces other solar generation and increases the supply ramping needed by peaker plants, which is expensive for utilities.[18] Battery storage systems flatten the duck curve by storing solar and wind energy at non-peak hours and discharging it at peak hours. California's most recent net energy metering policy now incentivizes systems with battery storage more than solar systems with no installed storage.
Housing affordability is also a concern with this measure, an area where California already struggles greatly.[19] According to a 2017 survey conducted by the U.S. Census Bureau, 37.8% of California homeowners with mortgages are "cost-burdened," with housing costs exceeding 30% of the household income, and 16.3% face housing costs exceeding 50% of the household income.[20] The CEC predicts that the requirement of photovoltaic panels will increase the cost of a newly built single-family home by about $40 per month in extra mortgage payments, but eventually save about $80 on electricity costs.[21] The CEC released data showing that the system would more than pay for itself, however charitable organizations such as Habitat for Humanity have expressed their concerns as this will require the organization to receive additional donations to pay for the photovoltaic panels that the group would be required to install on every house it builds.[22]
Photovoltaics
.jpg)
In 2011, California's goal to install 3,000 MW of distributed generation by 2016 was expanded to 12,000 MW by 2020.[23] California has more photovoltaics installed than any other federal state, and 48% of the U.S. total in 2010. For the first time in 2008 the installed photovoltaics exceeded the state's 354 MW of solar thermal (CSP).[24][25][26] There are plans to build over 15,000 MW of utility scale photovoltaic plants in California.[27] At the end of 2012, small systems of less than 10 kWp were averaging $5.39/W, and large systems of over 500 kWp were averaging $2.77/W.[28]
California has the technical potential to install 128.9 GW of rooftop solar panels, which would generate 194,000 GWh/year, about 74% of the total electricity used in California in 2013. This is environmentally desirable because it would conserve large swaths of desert by placing panels atop preexisting structures instead. However, this would supply three to four times peak midday demand, requiring output to be stored or exported on sunny days.[29]
 MWp of Installed Generating Capacity[30] |

|
Planned
- The Crimson Solar Project is a proposed 350 MW photovoltaic power station to be located southwest of Mesa Verde, California and will include an energy storage project.[32][33] The Bureau of Land Management gave final approval to Sonoran West Solar Holdings to build the installation on May 3, 2021.[34]
- The 400 MW Rexford solar farm in Tulare County (with 180MW/540MWh of energy storage) received a 15-year power purchase agreement in 2020, expected operational by 2023.[35]
Under construction
- The Blythe Solar Power Project is a partially completed 485 MW (235 active as of 2020) photovoltaic power station which is located in eastern Riverside County.
- The San Pablo Raceway Solar Plant is a 100 MW photovoltaic facility located in Los Angeles County that was in the beginning stages of construction in 2018.[36]
Operational

- The Desert Sunlight Solar Farm is a 550 MW solar power plant in Riverside County, that uses thin-film solar CdTe-modules made by First Solar. The plant was completed in December 2014.[37]
- The Imperial Valley Solar Project is a 99 MW power station, located in Imperial County.
- The California Valley Solar Ranch (CVSR) is a 250 MW solar photovoltaic power plant, built by SunPower in the Carrizo Plain, northeast of California Valley.[38]
- The Mount Signal Solar project was completed near the Mexican border in May 2014. The installed PV capacity of the solar farm amounts to 265.7 MW (206 MWAC).[39][40][41]
- The Topaz Solar Farm is a 550 MW power station located in San Luis Obispo County. It was completed in November 2014 and was the world's largest PV power plant at the time.
- The Desert Stateline Solar Facility is a 300 MW power plant near the Nevada border in San Bernardino County.
- The Redwood Solar Cluster is a group of 4 smaller solar generating stations that amount to 100 MW located in Kern County. The final phase was completed in March 2018.[42][43]
- The California Flats Solar Project is a 280 MW photovoltaic power plant located in Monterey County, which was opened in May 2019.[44]
- The Blythe Mesa Solar Power Project.
- The Maverick Solar Cluster is a group of 4 operational single-axis tracker photovoltaic power plants. The first part opened in Riverside County in January 2021. The group was completed in August 2022 at 620 MW dc and 457 MW ac, with a 50MW/200MWh battery energy storage system (BESS).[45] They are part of the larger Palen Solar Project.[46][47]
Solar thermal power

California has several large concentrated solar power plants.
The Ivanpah Solar Electric Generating System (392 MW), located 40 miles (60 km) southwest of Las Vegas and developed by BrightSource Energy and Bechtel, is the world's largest solar thermal power project.[48][49] The project has received a $1.375 billion loan guarantee from the United States Department of Energy. It deploys 347,000 heliostat mirrors focusing solar energy on boilers located on centralized solar power towers.[48]
The Genesis Solar Energy Project is an operational 250 MW solar thermal power station located in Riverside County, California. It features a parabolic trough design and is run by NextEra Energy Resources.[50]
Operational
- The Solar Energy Generating Systems, is a 361 MW (was 394 MW until 2014) parabolic trough concentrated solar power station located in the Mojave Desert completed in 1990.
- The Genesis Solar Energy Project, is a 280 MW parabolic trough concentrated solar power station located in the Mojave Desert completed in 2013.
- The Ivanpah Solar Power Facility, is a 392 MW solar power tower concentrated solar power station located in the Mojave Desert completed in 2014.
- The Mojave Solar Project, is a 280 MW parabolic trough concentrated solar power station located in the Mojave Desert completed in 2014.
Total operational installed gross power is 1,313 MW (1346 MW until 2014). Production in 2015 was 2,309 GWh, 71.2% of U.S. total solar thermal generation.[51]
Planned
South Belridge Oil Field, near Bakersfield, California, a solar EOR facility that is projected to eliminate 376,000 metric tons of carbon emissions. It was announced in November 2017 as a joint venture between GlassPoint Solar and Aera Energy.[52]
In 2012, the Bureau of Land Management gave priority status to 5 solar project proposals in California.[39] The 750 MW McCoy Solar Energy Project was proposed by NextEra, though only 1/3 of that wattage was ever installed. The remaining development of the project is currently[when?] on hold. The 100 MW Desert Harvest project has been proposed by enXco. The 664 MW Calico Solar Energy Project was redesigned by K Power but later abandoned.[53]
Generation


In 2022, California generated 62,414 GWh of solar electricity, making up 30% of the state's annual electricity generation. Of this solar energy, 37,237 GWh (59.7%) was produced by utility-scale PV, 23,094 GWh (37%) by distributed PV, and 2,083 GWh (3.3%) by utility-scale thermal.[54]
The Energy Information Administration (EIA) provides California electricity generation data from 2001. Below is a table of annual and monthly utility-scale solar generation, including thermal and PV generation, alongside the percentage of total annual CA energy generation and percentage of all US solar generation.
| Year | % of generation | Utility-scale solar generation in California (GWh) | |||||||||||||
|---|---|---|---|---|---|---|---|---|---|---|---|---|---|---|---|
| CA total | US solar | Total | Jan | Feb | Mar | Apr | May | Jun | Jul | Aug | Sep | Oct | Nov | Dec | |
| 2001 | 543 | 7 | 13 | 31 | 39 | 81 | 91 | 92 | 85 | 65 | 21 | 14 | 4 | ||
| 2002 | 555 | 11 | 24 | 44 | 46 | 58 | 96 | 86 | 75 | 53 | 31 | 28 | 4 | ||
| 2003 | 533 | 13 | 18 | 50 | 60 | 68 | 91 | 62 | 62 | 56 | 36 | 14 | 4 | ||
| 2004 | 569 | 12 | 10 | 53 | 56 | 81 | 88 | 82 | 73 | 60 | 33 | 15 | 8 | ||
| 2005 | 538 | 8 | 12 | 37 | 57 | 80 | 87 | 71 | 75 | 60 | 37 | 12 | 2 | ||
| 2006 | 495 | 12 | 19 | 32 | 51 | 69 | 68 | 60 | 81 | 53 | 32 | 15 | 3 | ||
| 2007 | 557 | 13 | 19 | 48 | 53 | 83 | 81 | 76 | 64 | 57 | 41 | 20 | 2 | ||
| 2008 | 669 | 12 | 28 | 56 | 71 | 76 | 100 | 90 | 85 | 73 | 46 | 21 | 11 | ||
| 2009 | 647 | 2 | 22 | 55 | 73 | 80 | 81 | 95 | 86 | 69 | 47 | 25 | 12 | ||
| 2010 | 0.4% | 63.5% | 771 | 2 | 21 | 51 | 75 | 106 | 121 | 117 | 105 | 86 | 39 | 34 | 14 |
| 2011 | 0.4% | 48.2% | 887 | 1 | 34 | 49 | 82 | 100 | 130 | 112 | 139 | 102 | 81 | 29 | 28 |
| 2012 | 0.7% | 31.9% | 1,382 | 4 | 36 | 88 | 128 | 176 | 219 | 191 | 152 | 148 | 115 | 72 | 53 |
| 2013 | 1.9% | 42.8% | 3,813 | 65 | 130 | 228 | 239 | 267 | 356 | 345 | 471 | 460 | 408 | 409 | 435 |
| 2014 | 5.0% | 54.0% | 9,932 | 358 | 409 | 711 | 842 | 978 | 1,085 | 1,000 | 1,095 | 1,072 | 969 | 809 | 604 |
| 2015 | 7.53% | 59.5% | 14,813 | 680 | 893 | 1,256 | 1,419 | 1,464 | 1,515 | 1,581 | 1,612 | 1,336 | 1,131 | 1,050 | 876 |
| 2016 | 9.5% | 52.2% | 18,807 | 716 | 1,195 | 1,316 | 1,545 | 1,924 | 1,851 | 2,167 | 2,145 | 1,911 | 1,609 | 1,389 | 1,039 |
| 2017 | 11.8% | 45.7% | 24,352 | 972 | 1,087 | 2,035 | 2,158 | 2,726 | 2,970 | 2,715 | 2,511 | 2,347 | 2,165 | 1,335 | 1,331 |
| 2018 | 13.7% | 40.5% | 26,986 | 1,242 | 1,751 | 2,005 | 2,509 | 3,024 | 3,253 | 2,814 | 2,837 | 2,689 | 2,124 | 1,505 | 1,233 |
| 2019 | 14.0% | 39.4% | 28,331 | 1,265 | 1,493 | 2,266 | 2,629 | 2,739 | 3,340 | 3,366 | 3,309 | 2,723 | 2,494 | 1,625 | 1,082 |
| 2020 | 15.0% | 33.9% | 30,271 | 1,534 | 2,074 | 2,031 | 2,561 | 3,395 | 3,388 | 3,824 | 3,181 | 2,498 | 2,297 | 1,936 | 1,552 |
| 2021 | 17.7% | 30.2% | 34,863 | 1,687 | 2,224 | 2,869 | 3,597 | 3,920 | 3,813 | 3,657 | 3,647 | 3,180 | 2,646 | 2,119 | 1,504 |
| 2022 | 19.2% | 27.0% | 39,320 | 2,098 | 2,474 | 3,242 | 3,651 | 4,218 | 4,456 | 4,288 | 3,987 | 3,466 | 3,221 | 2,387 | 1,832 |
| 2023 | % | % | 32,171 | 1,953 | 2,327 | 2,764 | 3,744 | 4,244 | 4,475 | 4,701 | 4,281 | 3,682 | |||
Beginning with 2014, the EIA has estimated distributed solar photovoltaic generation and distributed solar photovoltaic capacity.
| Year | Summer Capacity (MW) |
Electric energy (GWh) |
|---|---|---|
| 2014 | 2350 | 4,674 |
| 2015 | 3391.4 | 6,014 |
| 2016 | 5257.9 | 8,230 |
| 2017 | 6617.8 | 10,605 |
| 2018 | 7879.5 | 12,919 |
| 2019 | 15,162 | |
| 2020 | 17,407 | |
| 2021 | 19,828 | |
| 2022 | 23,094 |
Milestones
On May 13, 2017, the California Independent System Operator (CAISO) reported that the state had broken a new renewable energy record, with non-hydro renewables providing 67.2% of the total electricity on the ISO's grid (13.5% was provided by hydropower). The ISO reported that solar was providing approximately 17.2% of the total electricity.
On March 5, 2018, at around 1:00 pm, utility-scale solar energy met 50% of California's total electrical power demand for the first time.[57]
On May 2, 2022, CAISO reported that California's electrical demand was met 100% by renewable energy sources for the first time. This was maintained for nearly 15 minutes. During this period, 12,391 of the 18,000 megawatts (68.8%) of demand were generated by PV systems alone.[58]
Government support
Exemption from property tax
Since 1980, the state government excluded solar installations as taxable improvements on a property.[59][60] This has resulted in many counties seeing no tax benefit from solar farm installations, with some like Kern County stating that they had lost $110 million in property taxes over a decade due to this policy.[59][60]
State legislators felt that the policy was necessary because otherwise the property taxes on solar farms would be four to seven times higher in California than neighboring states, and would thereby incentive all new development of solar to occur out-of-state.[59]: 1
Renewable portfolio standard
California's renewable portfolio standard (RPS) sets a minimum of renewable generation from load-serving entities in the state. The most recent RPS was set under senate bill 100 and went into effect January 1, 2019. SB 100 mandates that 60% of California's electricity will be generated by renewable resources by 2030, and 100% will be generated by carbon-free sources by 2045.[61] Much of this is expected to come from solar power.
According to a report by the California Public Utilities Commission (CPUC), California failed to meet the 20% renewables by 2010 target. In 2010, Southern California Edison produced 19.4% of its electricity from renewable sources, Pacific Gas and Electric Company generated 17.7% of the electricity it sold from renewable sources, and San Diego Gas & Electric generated 11.9% of its electricity from renewable sources.[62]
As of October 2020, California had 31,288 MW[2] of solar and 5,830 MW[63] of wind farms. California adopted feed-in tariffs, a tool similar to what Europe has been using, to encourage the solar power industry. Proposals were raised aiming to create a small-scale solar market in California that brings the benefits of the German market, such as distributed generation, which avoids the need for transmission because power is generated close to where it is used, and avoid the drawbacks such as excessively high payments that could become a burden on utility customers.[64]
California Solar Initiative
The California Solar Initiative is a 2006 initiative to install 3,000 MW of additional solar power by 2016. Included in it is the Million Solar Roof Initiative.[65] In 2011, this goal was expanded to 12,000 MW by 2020.[66] As part of Governor Arnold Schwarzenegger's Million Solar Roofs Program, California has set a goal to create 1,940 megawatts[67] of new, solar-produced electricity by 2016 – moving the state toward a cleaner energy future and helping lower the cost of solar systems for consumers. The California Solar Initiative has "a total budget of $2.167 billion between 2007 and 2016 and a goal to install approximately 1,940 MW of new solar generation capacity." [68]
According to the CPUC, homeowners, businesses, and local governments installed 158 MW of solar photovoltaics (PV) in 2008, doubling the 78 MW installed in 2007, giving California a cumulative total of 441 MW of distributed solar PV systems, the highest in the country.[69] As of August 2016, 4,216 MW have been installed in 537,647 projects. The average cost of systems less than 10 kW is $5.33/watt and $4.38/watt for systems over 10 kW.[70] Of these, 3,391 MW were rooftop solar in 2015.[71]
The CSI initially offered cash incentives on solar PV systems of up to $2.50 per AC watt. These incentives, combined with federal tax incentives, could cover up to 50% of the total cost of a solar system. The incentive program was designed so that the incentives would reduce in steps based on the amount of solar installed in each of 6 categories. There are separate steps for residential and non-residential customers in the territories of each of the State's 3 investor-owned utilities. As of July 2012, the rebates range from $0.20 to $0.35 per AC watt for residential and commercial systems and from $0.70 to $1.10 for systems for non-profits and government entities.[68]
There are many financial incentives to support the use of renewable energy in other US states.[72] CSI provides more than $2 billion worth of incentives to customers for installing photovoltaic,[73] and electricity displacing solar thermal[74] systems in the three California Investor-Owned Utilities service territories.
The program was authorized by the California Public Utilities Commission and by the Senate Bill 1 (SB 1):
- Decision (D.) 06-01-024, in collaboration with the California Energy Commission, with the goal of installing 3,000 MW of new solar facilities in California's homes and businesses by 2017.
- On August 21, 2006, the Governor signed SB1, which directs the CPUC and the CEC to implement the CSI program consistent with specific requirements and budget limits set forth in legislation.
Responsibility for administration of the CSI Program is shared by Investor-Owned Utilities:
- Pacific Gas and Electric Company – PG&E customers;
- Southern California Edison Company – SCE customers;
- California Center for Sustainable Energy – SDG&E customers.
Residential installation starts in early 2007 fell off sharply in SCE territory because of the disincentives inherent in SB1, requiring time-of-use (TOU) tariffs, with the result that homeowners who install panels may find their electric bill increasing rather than decreasing. The governor and legislature moved quickly to pass AB1714 (June 2007) to delay the implementation of this rule until 2009.
Net metering
California's net energy metering program incentivizes distributed solar generation and battery storage by compensating customers for excess energy they export to the electric grid. A consumer's excess solar generation is bought by the local utility at or below retail pricing when it is exported, allowing consumers to "store" their own generation in the grid to be used at any time.[75]
Net metering was first implemented in 1995 in the passing of Senate Bill (SB) 656, known now as NEM1.
Out of 38 states evaluated in a rating of state net metering policy in 2007, California was one of five states to receive an A.[76] IREC best practices, based on experience, recommends no limits to net metering, individual or aggregate, and perpetual roll over of kWh credits.[77] As California was rapidly approaching the 5% aggregate limit, a May 24, 2012, ruling by the CPUC clarified the calculation of the limit, and requested a report on the cost of net metering.[78][79] California subsequently uncapped the net metering program.[80] Typically states have raised or eliminated their aggregate limits before they were reached.[81] By 2011, 16 states including California received an A for net metering.[82]
In 2013, Assembly Bill (AB) 327 mandated that a successor to the existing NEM1, NEM2, should be adopted by the CPUC. NEM2 went into effect in SDG&E's service territory on June 29, 2016, PG&E's service territory on December 15, 2016, and SCE's service territory on July 1, 2017.[83] One of NEM2's key objectives was to ensure continued growth of distributed solar by removing the 1,000kW limit on new systems. While NEM2 continued to compensate customers with full retail pricing, it also included three charges: a one-time interconnection fee, non-bypassable charges that fund low-income customers, energy efficiency programming and other energy programs, and a time-of-use (TOU) rate.[84]
California's current net metering policy is outlined in the Net Billing Tariff,[85] known as NEM3, which went into effect April 15th, 2023.[86] The Tariff takes into account proposals from various parties, including a lookback study on NEM 2.0 and 1.0.[83] While in NEM1 and 2 customers received credits for energy exported and deducted those credits when importing electricity from the grid at a nearly 1:1 exchange, under NEM3 energy exports are now valued at the avoided cost to the utility — the wholesale price it takes the utility to produce energy. Credits are typically $0.05 per kWh, but when electricity demand is high it can spike up to $2.87 per kWh.[86]
California's net metering policy was rated 19th by Solar Reviews in 2021, California receives a B only because electricity credits include charges and don't pay at full retail rate but at marginal cost.[87]
Mandatory solar power in new homes
In March 2008, Culver City established the first in the nation mandatory solar photovoltaic requirement, which requires an installation of 1 KW of solar photovoltaic power per 10,000 square feet (930 m2) of new or major remodeled commercial building area.[88]
In March 2013, Lancaster, California became the first U.S. city to mandate the inclusion of solar panels on new homes, requiring that "every new housing development must average 1 kilowatt per house."[89] In May 2013, Sebastopol followed suit, requiring new buildings include either 2 W/sq ft (21.7 W/m2) of insulated building space of photovoltaics, or enough to provide 75% of the expected annual electricity use.[90]
Since January 1, 2014, California law requires all new buildings less than ten stories tall be "solar ready".[91]
In April 2016, San Francisco mandated that all new buildings less than ten stories tall include solar panels or solar water heating covering at least 15% of the roof, beginning January 1, 2017.[92]
In 2018, the State of California Building Standards Commission approved solar installation requirements for all new residential buildings with three stories or fewer. This requirement took effect in 2020.[93]
Streamlined permitting
California governor Jerry Brown signed a streamlined permitting bill (AB 2188) for residential solar systems on September 22, 2014. AB 2188 has four major provisions designed to reduce red-tape associated with local solar permits and requires that, by the end of September 2015, all California cities and counties must "adopt an ordinance that creates an expedited, streamlined permitting process for residential rooftop solar energy systems of less than 10 kilowatts in size."[94] Research and industry reports project the bill could reduce the cost of installing a typical residential solar system in the state by over $1,000.[95]
Alameda County solar financing
Using a 20-year property assessment known as PACE financing, the city of Berkeley had a successful pilot program from 2008 to 2009 as the first city in the country to allow residents to obtain solar power without any initial payment. In the plan, property owners paid as much in increased property taxes as they save in energy costs, allowing them to install the panels for free at no cost to the city. Thirty eight projects were installed for the pilot stage of the program.[96] PACE financing has spread to 28 states, but is on hold in many due to objections by Freddie Mac and Fannie Mae, including in Berkeley (which has not continued the pilot as a result). Legislation has been introduced to require acceptance of PACE financing.[97]
City of Los Angeles feed-in tariff
The City of Los Angeles Department of Water and Power initiated a program on January 11, 2013, to pay up to 17 cents/kWh for electricity generated by up to 100 MW of solar power in a feed-in tariff program. 20 MW is reserved for small projects of less than 150 kW each. The program could be expanded to 150 MW in March.[98][99]
| Year | Available |
|---|---|
| 2013 | 40 MW |
| 2014 | 40 MW |
| 2015 | 20 MW |
| Tier | Available | Small systems | Feed in tariff |
|---|---|---|---|
| 1 | 10 MW | 2 MW | 17 cents/kWh |
| 2 | 25 MW | 5 MW | 16 cents/kWh |
| 3 | 50 MW | 10 MW | 15 cents/kWh |
| 4 | 75 MW | 15 MW | 14 cents/kWh |
| 5 | 100 MW | 20 MW | 13 cents/kWh |
State challenges with solar power
Energy storage is becoming a more prominent issue because photovoltaic solar panels can only generate electricity during daylight hours and thermal solar installations can only store energy for up to 10 hours, leaving a window in which the state's energy production must be generated from other sources (natural gas, wind, coal, or nuclear). To remedy this, different sorts of power storage solutions have been proposed such as batteries, compressed air, and ice generation.[100]
In April 2018, The San Diego Union Tribune reported that Recurrent Energy (a subsidiary of Canadian Solar) had proposed a large battery, a 350 MW system, to be installed alongside the proposed Crimson Solar Project. The battery will match the proposed facility's nameplate capacity, and is several times larger than the 130 MW Hornsdale Power Reserve, the largest lithium battery in existence, which was created by Tesla and is located in South Australia.[101]
Another issue is overproduction which is most common during the spring months, when electricity production from wind power is high, but demand from heating and cooling is low.[102] California's solar production was so vast that by 2017, California had to pay Arizona and other states in the region to accept some of its electricity during peak production hours to provide relief to its grid.[103]
California also has aggressive goals when it comes to zero emissions vehicles (ZEVs), and the most prominent type is the electric car, which relies on grid power to charge its battery. Plug-in hybrid cars are also very popular in the state. These types of vehicles add to the demand and burden placed on the electrical grid, which was not designed to support the larger electrical loads required by electric vehicles.[104] One potential solution is to bypass most of the grid with the installation of rooftop solar panels for daytime charging and making use of home energy storage at night. Some electric companies will also provide discounted rates for car owners who charge their vehicles at night when demand is lower. Some cars can be programmed to stagger their charging cycle throughout the night. This leads to a steady rate of charging instead of a large spike in the early evening when most commuters return home.[105]
Public opinion
The majority of Californians in desert country support large-scale solar development, according to a 2012 survey conducted on behalf of BrightSource Energy. The survey of more than 1,000 people was conducted throughout Imperial, Inyo, Kern, Riverside, San Bernardino counties in California, where many utility-scale solar projects are underway or planned. Survey results showed that nearly four out of five (almost 80 percent) people strongly supported development of solar power in their communities. The survey also found that the majority of people were concerned with climate change. It also found that two-thirds of respondents think renewable energy is important to California's future and that the state and federal government should help provide incentives for renewable energy projects.[106]
See also
- Wind power in California
- Solar power plants in the Mojave Desert
- Solar power in the United States
- Renewable energy in the United States
- Solar Cookers International
References
- ^ "California: Renewables Portfolio Standard". Database of State Incentives for Renewables & Efficiency. October 7, 2015. Retrieved March 10, 2023.
- ^ a b c "California Solar". Retrieved March 7, 2023.
- ^ a b "Electric Power Annual 2021 - U.S. Energy Information Administration". www.eia.gov. Retrieved March 11, 2023.
- ^ "California Energy Commission – Tracking Progress" (PDF). Retrieved March 19, 2018.
- ^ Sherwood, Larry (July 2014). "U.S. Solar Market Trends 2013" (PDF). Interstate Renewable Energy Council (IREC). Retrieved July 21, 2014.
- ^ Wesoff, Eric (June 26, 2015). "Solar Star, Largest PV Power Plant in the World, Now Operational". Greentech Media. Retrieved July 28, 2015.
- ^ Evan Halper (August 9, 2014). "Rules prevent solar panels in many states with abundant sunlight". Los Angeles Times. Retrieved August 30, 2014.
- ^ Million Solar Roofs Initiative
- ^ Cohen, Josh (January 8, 2018). "California Will Spend $1 Billion on Low-income, Multifamily Solar". Next City. Archived from the original on March 13, 2018. Retrieved September 15, 2019.
California is ready to spend $1 billion over the next decade on rooftop solar installation for low-income residents. In December, the California Public Utilities Commission (CPUC) approved the creation of the Solar on Multifamily Affordable Housing (SOMAH) program. Funded by the statewide greenhouse gas cap-and-trade program, it will provide $100 million in annual solar installation incentives for the owners of affordable multifamily buildings.
- ^ Commission, California Energy (January 2019). "2019 Residential Compliance Manual". California Energy Commission. Retrieved May 23, 2023.
- ^ Thoubboron, Kerry (November 7, 2019). "An overview of the California solar mandate". Energy Sage. Retrieved April 24, 2020.
- ^ "California Energy Commission approves first community solar proposal under 2019 Energy Code" (Press release). California Energy Commission. February 20, 2020. Retrieved May 8, 2020.
- ^ Kranking, Carlyn (February 20, 2020). "Regulators loosen California's groundbreaking rule to require residential rooftop solar". Cal Matters. Retrieved April 24, 2020.
- ^ Roth, Sammy (November 14, 2019). "California will still require rooftop solar panels on new homes — at least for now". Los Angeles Times. Retrieved November 14, 2019.
- ^ "California ISO - Today's Outlook". www.caiso.com. Retrieved May 29, 2023.
- ^ Collins, Jeff (May 4, 2018). "California to become first U.S. state mandating solar on new homes". The Orange County Registrar. Retrieved May 9, 2018.
- ^ "California ISO - Today's Outlook". www.caiso.com. Retrieved May 29, 2023.
- ^ Ramirez, Rachel (May 8, 2020). "These dirty power plants cost billions and only operate in summer. Can they be replaced?". Grist. Retrieved May 30, 2023.
- ^ US News Staff (February 27, 2018). "Best States 2018: How They Were Ranked". US News. Archived from the original on March 2, 2017. Retrieved May 9, 2018.
- ^ Kimberlin, Sara (April 2019). "California's Housing Affordability Crisis Hits Renters and Households With the Lowest Incomes the Hardest". California Budget and Policy Center. Retrieved May 2, 2020.
- ^ Thoubboron, Kerry (November 7, 2019). "An overview of the California solar mandate". Energy Sage. Retrieved April 24, 2020.
- ^ Chen, Angela (May 9, 2018). "California is requiring solar panels on all new houses: here's what that means". The Verge. Retrieved May 9, 2018.
- ^ 12,000 MW of Renewable Distributed Generation by 2020
- ^ California Solar Photovoltaic Statistics & Data retrieved March 1, 2009
- ^ "Solar Market Trends" (PDF).
- ^ (DAV-SEAC), NREL Data Analysis and Visualization Group. "The Open PV Project - Search". openpv.nrel.gov. Retrieved May 1, 2018.
- ^ "Major Solar Projects List". SEIA.
- ^ "California Solar Statistics". californiasolarstatistics.ca.gov. Retrieved May 1, 2018.
- ^ Rooftop Solar Photovoltaic Technical Potential in the United States: A Detailed Assessment
- ^ "California Solar". Solar Energy Industries Association. Retrieved March 16, 2021.
- ^ "PV Watts". NREL. Retrieved June 11, 2012.
- ^ "BLM SCHEDULES PUBLIC SCOPING MEETING ON CRIMSON SOLAR PROJECT". Bureau of Land Management. Retrieved April 19, 2018.
- ^ "Crimson Solar Project: More Public Meetings Discovered". Basin and Range Watch. Retrieved April 19, 2018.
- ^ "Interior Department Approves Solar Energy Project in California Desert". United States Department of the Interior. May 3, 2021. Retrieved June 30, 2022.
- ^ Hill, Joshua S. (September 16, 2020). "8minute Solar Energy unveil another massive Californian solar plus storage project". RenewEconomy.
- ^ Weaver, John (June 11, 2018). "sPower secures 100 MW solar power PPA with California aggregator". PV Magazine. Retrieved June 11, 2018.
- ^ "First Solar completes another half-gigawatt project in California". January 15, 2015.
- ^ "NRG Energy, NRG Yield and SunPower Begin Commercial Operations at 250 MW California Valley Solar Ranch". Retrieved May 1, 2018.
- ^ a b Bureau of Land Management (November 22, 2011). "2012 Renewable Energy Priority Projects". Archived from the original on January 28, 2012.
- ^ Mount Signal Solar Is Online: World's Largest Single Axis Solar PV Project, SustainableBusiness.com, May 23, 2014
- ^ 206MW Mt. Signal Solar Farm Completed, Energy Matters, May 22, 2014
- ^ "8minutenergy Celebrates Completion of 26 Megawatt Redwood 4 Solar Farm | 8minutenergy". 8minutenergy. March 7, 2018. Retrieved March 8, 2018.
- ^ "Redwood 4 blooms in California". reNEWS - Renewable Energy News. March 7, 2018. Retrieved March 8, 2018.
- ^ "First Solar: California Flats".
- ^ "EDF Renewables brings online 620MWdc multi-stage PV project with 200MWh BESS in California". Energy Storage News. August 18, 2022.
- ^ "EDF Renewables North America Announces Commercial Operations at Maverick 1 and Maverick 4 Solar Projects". Business Wire. January 19, 2021. Retrieved January 20, 2021.
- ^ Holbrook, Emily (January 20, 2021). "EDF Renewables Announces 2 Southern California Solar Projects Now Online". Environmental Leader. Retrieved January 20, 2021.
- ^ a b Todd Woody. In California’s Mojave Desert, Solar-Thermal Projects Take Off Archived November 5, 2010, at the Wayback Machine Yale Environment 360, October 27, 2010.
- ^ "Solar energy plant in California gets new partner in NRG". Power Engineering International. PennWell Corporation. October 28, 2010. Retrieved October 29, 2010.
- ^ Another Huge Solar Plant Goes Online in California's Desert Archived May 15, 2016, at the Portuguese Web Archive, Chris Clarke, REWIRE, May 5, 2014
- ^ "Electric Power Monthly with Data for December 2015" (PDF). U.S. Energy Information Administration. February 2016. Retrieved March 9, 2015.
- ^ "GlassPoint Announces Belridge Solar Project".
- ^ K Road Gives Up on Calico Solar Project, RenewableEnergyWorld.com, James Montgomery, July 1, 2013
- ^ a b c "Electricity Data Browser". U.S. Energy Information Administration. U.S. Department of Energy. March 28, 2018. Retrieved March 10, 2023.
- ^ "Electric Power Monthly - U.S. Energy Information Administration (EIA)". www.eia.gov. Retrieved November 23, 2023.
- ^ "Electric Power Monthly"[1] |title=Electric Power Monthly (February 2019 with data for December 2018) - Table 6.2.B. Net Capacity from Solar Photovoltaic retrieved 2019 3 17
- ^ Pyper, Julia (March 6, 2018). "California Sets Two New Solar Records". Green Tech Media. Retrieved February 7, 2019.
- ^ Kennedy, Ryan (May 2, 2022). "For the first time in history, California's demand was 100% matched by renewable energy generation". PV Magazine. Retrieved June 30, 2022.
- ^ a b c Anderson, Mark (September 21, 2022). "Newsom signs solar construction tax exemption extension". Sacramento Business Journal.
California has extended a property tax exclusion for new solar energy systems to incentivize the construction of large-scale solar plants to meet the state's electrification goals. Gov. Gavin Newsom signed Senate Bill 1340 on Sunday, continuing a property tax exclusion for new solar systems until the end of 2026. ... The exclusion continues what has been California law, in some form, since 1980.
- ^ a b Roth, Sammy (January 17, 2023). "Want to solve climate change? This California farm kingdom holds a key". Los Angeles Times.
Hawk is also frustrated that solar farms don't pay property taxes — an exemption recently extended by state lawmakers.
- ^ "Renewables Portfolio Standard (RPS) Program". cpuc.ca.gov.
- ^ "California Utilities Do Not Meet 2010 Renewable Energy Goal".
- ^ "U.S. Wind Industry Report". American Wind Energy Association. 2014. Retrieved November 3, 2014.
- ^ "California Eyes Euro-Style Market For Solar". Dow Jones Newswires. October 6, 2009. Archived from the original on October 10, 2009.
- ^ "The California Solar Initiative". Archived from the original on February 23, 2009.
- ^ Seba, Tony. "The eBay of Electricity". Forbes. Retrieved May 1, 2018.
- ^ About the California Solar Initiative Archived March 7, 2013, at the Wayback Machine.
- ^ a b The California Solar Initiative.
- ^ CPUC Press Release
- ^ "Welcome to California Solar Statistics". Archived from the original on February 5, 2016. Retrieved January 13, 2023.
- ^ 2016 State of the Interconnection page 10-14 + 18-23. WECC, 2016. Archive
- ^ Financial Incentives in the USA Archived January 9, 2008, at the Wayback Machine.
- ^ CSI Handbook
- ^ California Public Utilities Commission press release "CPUC establishes California Solar Initiative requirements for solar thermal technologies", December 20, 2007. Retrieved February 15, 2008.
- ^ Dufo-López, Rodolfo; Bernal-Agustín, José L. (May 1, 2015). "A comparative assessment of net metering and net billing policies. Study cases for Spain". Energy. 84: 684–694. doi:10.1016/j.energy.2015.03.031. ISSN 0360-5442.
- ^ "Report: States Falling Short on Interconnection and Net Metering". Archived from the original on May 15, 2008.
- ^ "Net Metering and Interconnection Procedures Incorporating Best Practices" (PDF).
- ^ "Freeing the Grid". freeingthegrid.org. Retrieved April 13, 2018.
- ^ Decision Regarding Calculation of the Net Energy Metering Cap
- ^ "Solar homeowners win big in California ruling, for now". San Francisco Chronicle. Retrieved April 13, 2018.
- ^ "2011 Updates and Trends" (PDF).
- ^ "Freeing the Grid". freeingthegrid.org. Retrieved April 13, 2018.
- ^ a b Verdant Associates, LLC (January 21, 2021). Net-Energy Metering 2.0 Lookback Study (PDF) (Report). California Public Utilities Commission. Retrieved May 30, 2023.
- ^ "The History Of Net Metering And How To Combat NEM3 Policies » VECKTA". December 7, 2022. Retrieved May 29, 2023.
- ^ Hymes, Kelly (November 10, 2022). Decision Revising Net Energy Metering Tariff and Subtariffs. Rulemaking 20-08-020 (PDF) (Report). California Public Utilities Commission. Retrieved May 27, 2023.
- ^ a b "Net Billing Tariff | Tesla Support". Tesla. Retrieved May 29, 2023.
- ^ "The state of net metering in the United States in 2021". Solar Reviews. January 27, 2021. Retrieved May 30, 2023.
- ^ "Culver City Building Safety Division Mandatory Solar Photovoltaic Requirement". culvercity.org (official website). City of Culver City. Retrieved March 22, 2018.
- ^ "Lancaster, CA, Becomes First US City to Require Solar". Greentech Media. March 27, 2013.
- ^ "California town of Sebastopol will require solar panels on all new homes". Grist. May 9, 2013. Retrieved April 13, 2018.
- ^ "California poised to require 'solar ready roofs' on new homes and buildings". The Mercury News. May 30, 2012. Retrieved April 13, 2018.
- ^ Pentland, William. "San Francisco Becomes First Major U.S. City To Mandate Rooftop Solar In New Buildings". Forbes. Retrieved April 13, 2018.
- ^ Flemming, Jack. "Starting in 2020, all new homes in California must come with solar panels. Builders are getting ready". Los Angeles Times. Retrieved June 27, 2019.
- ^ Eric Wesoff (September 22, 2014). "New California Law Cuts Solar-Permitting Red Tape". GreenTech Media. Retrieved September 23, 2014.
- ^ Chad Garland (August 23, 2014). "Assembly bill could lower cost of residential solar in California". Los Angeles Times. Retrieved September 23, 2014.
- ^ Berkeley FIRST Archived June 2, 2013, at the Wayback Machine retrieved February 4, 2009
- ^ "Property Assessed Clean Energy Financing (PACE)".
- ^ "Los Angeles DWP unveils solar power buyback program". LA Times Blogs - L.A. NOW. January 11, 2013. Retrieved April 13, 2018.
- ^ "Feed-in Tariff (FiT) Program". ladwp.com. Retrieved April 13, 2018.
- ^ Brady, Jeff (April 5, 2016). "Solar And Wind Energy May Be Nice, But How Can We Store It?". NPR. Archived from the original on May 1, 2016. Retrieved September 15, 2019.
- ^ Roth, Sammy (April 12, 2018). "World's biggest battery could power up in California". The San Diego Union-Tribune.
- ^ "Solar and wind power curtailments are rising in California". U.S. Energy Information Administration. Retrieved November 23, 2023.
- ^ "California invested heavily in solar power. Now there's so much that other states are sometimes paid to take it". Los Angeles Times. July 22, 2017. Retrieved August 23, 2022.
- ^ Sperling, Daniel (October 1, 2013). "Plug-in vehicles generate new variables for power grids". Institute of Electrical and Electronics Engineers. Retrieved April 13, 2018.
- ^ Bullis, Kevin (August 16, 2013). "Could Electric Cars Threaten the Grid?". MIT Technology Review. Retrieved April 13, 2018.
- ^ Chris Meehan (February 20, 2012). "New survey finds most in California desert support solar". Clean Energy Authority.
External links
- Go Solar California
- California Energy Commission
- California Solar Energy Industries Association
- Northern California Solar Energy Association
- Solar California
- Renewables Portfolio Standard
- California's Renewable Energy Law Lives!
- Clean Power Estimator (California only)
- California daily hourly power production
- Google Map of Operating and Under Construction California Utility Scale PV
- NREL solar insolation map