New York's 22nd congressional district
| New York's 22nd congressional district | |||
|---|---|---|---|
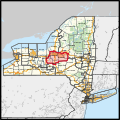
Interactive map of district boundaries | |||
| Representative |
| ||
| Distribution |
| ||
| Population (2022) | 764,843 | ||
| Median household income | $68,941[1] | ||
| Ethnicity |
| ||
| Cook PVI | D+1[2] | ||
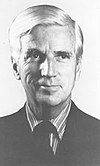
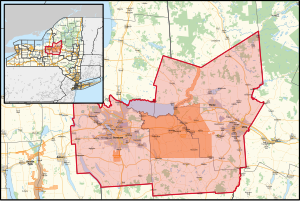
New York's 22nd congressional district is a congressional district for the United States House of Representatives currently represented by Republican Brandon Williams. Significant cities in the district include Syracuse, Utica, and Rome. It is home to several colleges and universities, including Syracuse University, Hamilton College, Colgate University, SUNY Polytechnic Institute, and Utica University.
The district consists of Madison, Oneida, and Onondaga Counties, as well as a sliver of Oswego County.
Recent statewide election results
Results under current lines (2023-2025)[3]
| Year | Office | Result |
|---|---|---|
| 2016 | President | Clinton 47.9 - 45.8% |
| 2020 | President | Biden 52.6 - 45.2% |
Results under future lines (since 2025)[4]
| Year | Office | Result |
|---|---|---|
| 2016 | President | Clinton 49.6 - 43.9% |
| 2016 | Senate | Schumer 67.2 - 30.5% |
| 2018 | Senate | Gillibrand 59.4 - 40.5% |
| 2018 | Governor | Molinaro 46.0 - 45.2% |
| 2020 | President | Biden 55.8 - 44.2% |
| 2022 | Senate | Schumer 53.7 - 45.7% |
| 2022 | Governor | Zeldin 51.0 - 48.8% |
| 2022 | Attorney General | James 50.1 - 49.9% |
| 2022 | Comptroller | DiNapoli 54.2 - 45.8% |
History
2023–2025:
2013–2023:
2003–2012:
1993–2003:
- All of Columbia, Greene, Warren, Washington
- Parts of Dutchess, Essex, Rensselaer, Saratoga, Schoharie
1983–1993:
- All of Rockland
- Parts of Orange, Sullivan, Westchester
1953–1983:
- Parts of Bronx
1945–1953:
- Parts of Manhattan
1919–1945:
1913–1919:
- Parts of New York
Various New York districts have been numbered "22" over the years, including areas in New York City and various parts of upstate New York. From 2003 to 2013, the district included all or parts of Broome, Delaware, Dutchess, Orange, Sullivan, Tioga, Tompkins, and Ulster counties. It included the cities of Binghamton, Ithaca, Kingston, Middletown, Newburgh and Poughkeepsie. The district stretched to include parts of the Finger Lakes region, the Catskill Mountains, and the Hudson Valley.


List of members representing the district
1821–1833: one seat
District was created on March 4, 1821, split from the 2-seat 21st district.
| Member | Party | Years | Cong ress |
Electoral history | Location |
|---|---|---|---|---|---|
| District established March 4, 1821 | |||||
| Vacant | March 4, 1821 – December 3, 1821 |
17th | Elections were held in April 1821. It is unclear when results were announced or credentials issued. | 1821–1823 [data missing] | |
| Albert H. Tracy (Buffalo)[5] |
Democratic-Republican | December 3, 1821 – March 3, 1823 |
17th | Elected in 1821. Redistricted to the 30th district. | |
| Justin Dwinell (Cazenovia)[5] |
Democratic-Republican | March 4, 1823 – March 3, 1825 |
18th | Elected in 1822. [data missing] |
1823–1833 Madison and Cortland counties |
| John Miller (Truxton)[5] |
Anti-Jacksonian | March 4, 1825 – March 3, 1827 |
19th | Elected in 1824. [data missing] | |
| John G. Stower (Hamilton)[5] |
Jacksonian | March 4, 1827 – March 3, 1829 |
20th | Elected in 1826. [data missing] | |
| Thomas Beekman (Peterboro)[5] |
Anti-Jacksonian | March 4, 1829 – March 3, 1831 |
21st | Elected in 1828. [data missing] | |
| Edward C. Reed (Homer)[5] |
Jacksonian | March 4, 1831 – March 3, 1833 |
22nd | Elected in 1830. [data missing] | |
1833–1843: two seats
From 1833 to 1843, two seats were apportioned, elected at-large on a general ticket.
1843–present: one seat
Election results
In New York State electoral politics there are numerous minor parties at various points on the political spectrum. Certain parties will invariably endorse either the Republican or Democratic candidate for every office, hence the state electoral results contain both the party votes, and the final candidate votes (Listed as "Recap").
| Party | Candidate | Votes | % | |
|---|---|---|---|---|
| Republican | Gerald B.H. Solomon (Incumbent) | 144,125 | 60.5 | |
| Democratic | Steve James | 94,192 | 39.5 | |
| Margin of victory | 49,933 | 21.0 | ||
| Turnout | 238,317 | ? | ||
| Republican hold | ||||
| Party | Candidate | Votes | % | ±% | |
|---|---|---|---|---|---|
| Republican | John E. Sweeney | 106,919 | 55.3 | −5.2 | |
| Democratic | Jean P. Bordewich | 81,296 | 42.1 | +2.6 | |
| Right to Life | Francis A. Giroux | 5,051 | 2.6 | +2.6 | |
| Margin of victory | 25,623 | 13.3 | −7.7 | ||
| Turnout | 193,266 | ? | −18.9 | ||
| Republican hold | Swing | ? | |||
| Party | Candidate | Votes | % | ±% | |
|---|---|---|---|---|---|
| Republican | John E. Sweeney (Incumbent) | 167,368 | 67.9 | +12.6 | |
| Democratic | Kenneth F. McCallion | 79,111 | 32.1 | −10.0 | |
| Margin of victory | 88,257 | 35.8 | +22.5 | ||
| Turnout | 246,479 | ? | +27.5 | ||
| Republican hold | Swing | ? | |||
| Party | Candidate | Votes | % | ±% | |
|---|---|---|---|---|---|
| Democratic | Maurice Hinchey (Incumbent) | 113,280 | 64.2 | +32.1 | |
| Republican | Eric Hall | 58,008 | 32.9 | −35.0 | |
| Green | Steve Greenfield | 2,723 | 1.5 | +1.5 | |
| Right to Life | Paul J. Laux | 2,473 | 1.4 | +1.4 | |
| Margin of victory | 55,272 | 31.3 | −4.5 | ||
| Turnout | 176,484 | ? | −28.4 | ||
| Democratic gain from Republican | Swing | ? | |||
| Party | Candidate | Votes | % | ±% | |
|---|---|---|---|---|---|
| Democratic | Maurice Hinchey (Incumbent) | 167,489 | 67.2 | +3.0 | |
| Republican | William A. Brenner | 81,881 | 32.8 | −0.1 | |
| Margin of victory | 85,608 | 34.3 | +3.0 | ||
| Turnout | 249,370 | ? | +41.3 | ||
| Democratic hold | Swing | ? | |||
| Party | Candidate | Votes | % | ±% | |
|---|---|---|---|---|---|
| Democratic | Maurice Hinchey (Incumbent) | 121,683 | 100.0 | +32.8 | |
| Margin of victory | 121,683 | 100.0 | +65.7 | ||
| Turnout | 121,683 | ? | −51.2 | ||
| Democratic hold | Swing | ? | |||
| Party | Candidate | Votes | % | ±% | |
|---|---|---|---|---|---|
| Democratic | Maurice Hinchey (Incumbent) | 168,558 | 58.1 | −41.9 | |
| Republican | George Phillips | 85,126 | 29.3 | +29.3 | |
| Margin of victory | 83,432 | 28.8 | −41.9 | ||
| Turnout | 290,102 | ? | +138 | ||
| Democratic hold | Swing | ? | |||
| Party | Candidate | Votes | % | ±% | |
|---|---|---|---|---|---|
| Democratic | Maurice Hinchey (Incumbent) | 90,613 | 52.4 | −5.7 | |
| Republican | George Phillips | 82,385 | 47.6 | +18.3 | |
| Margin of victory | 8,228 | 4.8 | −24.4 | ||
| Turnout | 172,998 | ? | −59.6 | ||
| Democratic hold | Swing | ? | |||
| Party | Candidate | Votes | % | ±% | |
|---|---|---|---|---|---|
| Republican | Richard L. Hanna (Incumbent) | 157,941 | 60.7 | +13.1 | |
| Democratic | Dan Lamb | 102,080 | 39.3 | −12.9 | |
| Margin of victory | 55,861 | 21.4 | −15.2 | ||
| Turnout | 280,082 | ? | N/A | ||
| Republican gain from Democratic | Swing | ? | |||
| Party | Candidate | Votes | % | ±% | |
|---|---|---|---|---|---|
| Republican | Richard L. Hanna (Incumbent) | 129,851 | 100.0 | +39.3 | |
| Margin of victory | 129,851 | 100.0 | N/A | ||
| Turnout | 175,372 | ? | N/A | ||
| Republican hold | Swing | ? | |||
| Party | Candidate | Votes | % | ±% | |
|---|---|---|---|---|---|
| Republican | Claudia Tenney | 129,444 | 46.5 | −53.5 | |
| Democratic | Kim Myers | 114,266 | 41.1 | N/A | |
| Upstate Jobs | Martin Babinec | 34,638 | 12.4 | N/A | |
| Margin of victory | 15,278 | 5.4 | N/A | ||
| Turnout | 278,348 | ? | N/A | ||
| Republican hold | Swing | ? | |||
| Party | Candidate | Votes | % | ±% | |
|---|---|---|---|---|---|
| Democratic | Anthony Brindisi | 127,715 | 50.9 | +9.8 | |
| Republican | Claudia Tenney (Incumbent) | 123,242 | 49.1 | +2.6 | |
| Margin of victory | 4,473 | 1.8 | N/A | ||
| Turnout | 250,957 | ? | N/A | ||
| Democratic gain from Republican | Swing | ? | |||
| Party | Candidate | Votes | % | ±% | |
|---|---|---|---|---|---|
| Republican | Claudia Tenney | 156,098 | 48.84 | −0.166 | |
| Democratic | Anthony Brindisi (Incumbent) | 155,989 | 48.80 | −2.0 | |
| Libertarian | Keith Price | 6,780 | 2.125 | N/A | |
| Write-in | 771[8] | 0.24 | N/A | ||
| Margin of victory | 109 | 0.034 | N/A | ||
| Turnout | 318,998 | ? | N/A | ||
| Republican gain from Democratic | Swing | ? | |||
| Party | Candidate | Votes | % | ±% | |
|---|---|---|---|---|---|
| Republican | Brandon Williams | 135,544 | 50.46 | +1.62 | |
| Democratic | Francis Conole | 132,913 | 49.48 | +0.68 | |
| Write-in | 151 | 0.06 | N/A | ||
| Margin of victory | 2,631 | 0.98 | N/A | ||
| Turnout | 268,608 | ? | N/A | ||
| Republican hold | Swing | ? | |||
See also
- List of United States congressional districts
- New York's congressional districts
- United States congressional delegations from New York
References
- ^ "My Congressional District (NY-22)". www.census.gov. Retrieved October 5, 2023.
- ^ "2022 Cook PVI: District Map and List". Cook Political Report. Retrieved January 10, 2023.
- ^ "2022 Cook PVI: District Map and List". Cook Political Report. Retrieved January 23, 2023.
- ^ "DRA 2020". Daves Redistricting. Retrieved March 24, 2024.
- ^ a b c d e f g h i j k l m n o p q r s t u v w x y z aa ab ac ad ae af ag ah ai aj ak al am an ao ap aq ar as at au av aw ax ay az ba bb bc https://www.govinfo.gov/content/pkg/GPO-CDOC-108hdoc222/pdf/GPO-CDOC-108hdoc222.pdf
- ^ Weiner, Mark (August 5, 2022). "GOP's Brandon Williams doesn't live in new CNY House district, vows to move in if elected". syracuse. Retrieved September 20, 2023.
- ^ "New York's 22nd House District Election Results: Claudia Tenney vs. Anthony Brindisi". NY Times. November 7, 2018. Retrieved November 7, 2018.
- ^ "New York Election Results: 22nd Congressional District". The New York Times. November 3, 2020. ISSN 0362-4331. Retrieved September 6, 2021.
- Martis, Kenneth C. (1989). The Historical Atlas of Political Parties in the United States Congress. New York: Macmillan Publishing Company.
- Martis, Kenneth C. (1982). The Historical Atlas of United States Congressional Districts. New York: Macmillan Publishing Company.
- Congressional Biographical Directory of the United States 1774–present
- 2008 House election data
- 2004 House election data Clerk of the House of Representatives
- 2002 House election data "
- 2000 House election data "
- 1998 House election data "
- 1996 House election data "


