
Genetic monitoring
Genetic monitoring is the use of molecular markers to (i) identify individuals, species or populations, or (ii) to quantify changes in population genetic metrics (such as effective population size, genetic diversity and population size) over time. Genetic monitoring can thus be used to detect changes in species abundance and/or diversity, and has become an important tool in both conservation and livestock management. The types of molecular markers used to monitor populations are most commonly mitochondrial, microsatellites or single-nucleotide polymorphisms (SNPs), while earlier studies also used allozyme data. Species gene diversity is also recognized as an important biodiversity metric for implementation of the Convention on Biological Diversity.[1]
Types
Types of population changes that can be detected by genetic monitoring include population growth and decline, spread of pathogens, adaptation to environmental change, hybridization, introgression and habitat fragmentation events. Most of these changes are monitored using ‘neutral’ genetic markers (markers for which mutational changes do not change their adaptive fitness within a population). However markers showing adaptive responses to environmental change can be ‘non-neutral’ (e.g. mutational changes affect their relative fitness within a population).

Two broad categories of genetic monitoring have been defined:[2] Category I encompasses the use of genetic markers as identifiers of individuals (Category Ia), populations and species (Category Ib) for traditional population monitoring. Category II represents the use of genetic markers to monitor changes of population genetic parameters, which include estimators of effective population size (Ne), genetic variation, population inter-mixing, structure and migration.
Examples
Estimating abundance and life history parameters – Category Ia
At the individual level, genetic identification can enable estimation of population abundance and population increase rates within the framework of mark-recapture models. The abundance of cryptic or elusive species that are difficult to monitor can be estimated by collecting non-invasive biological samples in the field (e.g. feathers, scat or fur) and using these to identify individuals through microsatellite or single-nucleotide polymorphism (SNP) genotyping. This census of individuals can then be used to estimate population abundance via mark-recapture analysis. For example, this technique has been used to monitor populations of grizzly bear,[3] brush-tailed rock-wallaby,[4] Bengal tiger[5] and snow leopard.[6] Population growth rates are a product of rates of population recruitment and survival, and can be estimated through open mark-recapture models. For example, DNA from feathers shed by the eastern imperial eagle shows lower cumulative survival over time than seen for other long-lived raptors.[7]
-
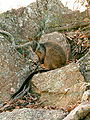
 Grizzly bear
 -
 Brush-tailed rock-wallaby
 -
 Snow leopard
 -
 Eastern imperial eagle


Identifying species – Category Ib
Use of molecular genetic techniques to identify species can be useful for a number of reasons. Species identification in the wild can be used to detect changes in population ranges or site occupancy, rates of hybridization and the emergence and spread of pathogens and invasive species. Changes in population ranges have been investigated for Iberian lynx[8] and wolverine,[9] while monitoring of westslope cutthroat trout shows widespread ongoing hybridization with introduced rainbow trout[10] (see cutbow) and Canada lynx-bobcat hybrids have been detected at the southern periphery of the current population range for lynx.[11][12] The emergence and spread of pathogens can be tracked using diagnostic molecular assays – for example, identifying the spread of West Nile virus among mosquitoes in the eastern US to identify likely geographical origins of infection[13] and identifying gene loci associated with parasite susceptibility in bighorn sheep.[14] Genetic monitoring of invasive species is of conservation and economic interest, as invasions often affect the ecology and range of native species and may also bring risks of hybridization (e.g. for copepods,[15] ducks,[16] barred owl and spotted owl,[17] and Lessepsian rabbitfish[18]).
-
 Iberian lynx
 -
 Wolverine
 -
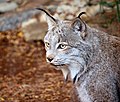 Canadian lynx
 -
 Spotted owl


Species identification is also of considerable utility in monitoring fisheries and wildlife trade, where conventional visual identification of butchered or flensed products is difficult or impossible.[19] Monitoring of trade and consumption of species of conservation interest can be carried out using molecular amplification and identification of meat or fish obtained from markets. For example, genetic market surveys have been used to identify protected species and populations of whale (e.g., North Pacific minke whale) and dolphin species appearing in the marketplace.[20] Other surveys of market trade have focused on pinnipeds,[21] sea horses[22] and sharks.[23] Such surveys are used to provide ongoing monitoring of the quantity and movement of fisheries and wildlife products through markets and for detecting poaching or other illegal, unreported or unregulated (IUU) exploitation [19] (e.g. IUU fishing).
Although initial applications focused on species identification and population assessments, market surveys also provide the opportunity for a range of molecular ecology investigations including capture-recapture, assignment tests and population modeling.[19] These developments are potentially relevant to genetic monitoring Category II.
-

-
 Dried sea horses
 -
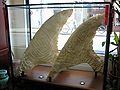 Shark fins


Monitoring population genetic parameters – Category II
Monitoring of population changes through genetic means can be done retrospectively, through analysis of 'historical' DNA recovered from museum-archived species and comparison with contemporary DNA of that species. It can also be used as a tool for evaluating ongoing changes in the status and persistence of current populations. Genetic measures of relative population change include changes in diversity (e.g. heterozygosity and allelic richness). Monitoring of relative population changes through these metrics has been performed retrospectively for Beringian bison,[24] Galapagos tortoise,[25] houting,[26] Atlantic salmon,[27] northern pike,[28] New Zealand snapper,[29] steelhead trout,[30] greater prairie chicken,[31] Mauritius kestrel[32] and Hector's dolphin[33] and is the subject of many ongoing studies, including Danish and Swedish brown trout populations.[34][35] Measuring absolute population changes (e.g. effective population size (Ne)) can be carried out by measuring changes in population allele frequencies (‘Ftemporal’) or levels of linkage disequilibrium over time (‘LDNe’), while changing patterns of gene flow between populations can also be monitored by estimating differences in allele frequencies between populations over time. Subjects of such studies include grizzly bears,[3][36][37] cod,[38] red deer,[39] Leopard frogs[40] and Barrel Medic.[41][42]
-
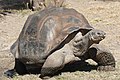 Galapagos giant tortoise
 -
 Atlantic salmon
 -
 Hector's dolphin
 -
 Northern leopard frog


Genetic monitoring has also been increasingly used in studies that monitor environmental changes through changes in the frequency of adaptively selected markers. For example, the genetically controlled photo-periodic response (hibernating time) of pitcher-plant mosquitos (Wyeomyia smithii) has shifted in response to longer growing seasons for pitcher plants brought on by warmer weather.[43] Experimental wheat populations grown in contrasting environments over a period of 12 generations found that changes in flowering time were closely correlated with regulatory changes in one gene, suggesting a pathway for genetic adaptation to changing climate in plants.[44][45]
Genetic monitoring is also useful in monitoring the ongoing health of small, relocated populations. Good examples of this are found for New Zealand birds, many species of which were greatly impacted by habitat destruction and the appearance of numerous mammalian predators in the last century and have recently become part of relocation programs that transfer a few ‘founder’ individuals to predator-free offshore “ecological” islands. E.g. black robin,[46] and kākāpō.[47]
Category II genetic monitoring of population genetic diversity (PGD) of wild species, for purposes of biodiversity conservation and sustainable management, is unevenly distributed among countries in Europe. Country size and per capita Gross Domestic Product (GDP) are statistically associated in different ways with the number of documented monitoring projects, suggesting that available habitat for species and country financial resources influence monitoring effort. There is relatively little genetic monitoring for PGD conducted in southeastern Europe. Much attention has been directed towards monitoring of large carnivores, and relatively little effort towards monitoring species in other groups, such as amphibians. [48]
-
 Barrel medic
 -
 Common wheat
 -
 Pitcher plant mosquito
 -
 Kākāpō – New Zealand night parrot


Status of genetic monitoring in science
In February 2007 an international summit was held at the Institute of the Environment at UCLA, concerning ‘Evolutionary Change in Human Altered Environments: An International Summit to translate Science into Policy’. This led to a special issue of the journal of Molecular Ecology[49] organized around our understanding of genetic effects in three main categories: (i) habitat disturbance and climate change (ii) exploitation and captive breeding (iii) invasive species and pathogens.
In 2007 a Working Group on Genetic Monitoring was launched with joint support from NCEAS[50] and NESCent[51] to further develop the techniques involved and provide general monitoring guidance for policy makers and managers.[52]
Currently the topic is covered in several well known text books, including McComb et al. (2010) and Allendorf et al. (2013).
Genetic monitoring in natural resource agencies
Many natural resource agencies see genetic monitoring as a cost-effective and defensible way to monitor fish and wildlife populations. As such scientists in the U.S. Geological Survey, U.S. Forest Service,[53] National Park Service, and National Marine Fisheries Service have been developing new methods and tools to use genetic monitoring, and applying such tools across broad geographic scales.[2][36] Currently the USFWS hosts a website that informs managers as to the best way to use genetic tools for monitoring (see below).
See also
References
- ^ Website of the Convention on Biological Diversity
- ^ a b c Schwartz, M.K.; et al. (2007). "Genetic monitoring as a promising tool for conservation and management" (PDF). Trends Ecol. Evol. 22 (1): 25–33. doi:10.1016/j.tree.2006.08.009. PMID 16962204.
- ^ a b Boulanger, J.; et al. (2004). "Monitoring of grizzly bear population trends and demography using DNA mark-recapture methods in the Owikeno Lake area of British Columbia". Canadian Journal of Zoology. 82 (8): 1267–1277. doi:10.1139/Z04-100.
- ^ Piggott, M.P.; et al. (2006). "Estimating population size of endangered Brush-tailed Rock-wallaby (Petrogale penicillata) colonies using faecal DNA". Mol. Ecol. 15 (1): 81–91. doi:10.1111/j.1365-294X.2005.02783.x. PMID 16367832. S2CID 9147442.
- ^ Bhagavatula, J.; Singh, L. (2006). "Genotyping faecal samples of Bengal tiger Panthera tigris tigris for population estimation: A pilot study". BMC Genet. 7: 48. doi:10.1186/1471-2156-7-48. PMC 1636336. PMID 17044939.
- ^ Jaňecka, J.E.; et al. (2008). "Population monitoring of snow leopards using noninvasive collection of scat samples: a pilot study". Animal Conservation. 11 (5): 401–411. doi:10.1111/j.1469-1795.2008.00195.x. S2CID 20787622.
- ^ Rudnick, J.A.; et al. (2005). "Using naturally shed feathers for individual identification, genetic parentage analyses, and population monitoring in an endangered Eastern imperial eagle (Aquila heliaca) population from Kazakhstan". Mol. Ecol. 14 (10): 2959–2967. doi:10.1111/j.1365-294X.2005.02641.x. PMID 16101766. S2CID 14165843.
- ^ Fernández, N.; et al. (2006). "Landscape evaluation in conservation: molecular sampling and habitat modeling for the Iberian lynx". Ecol. Appl. 16 (3): 1037–1049. doi:10.1890/1051-0761(2006)016[1037:LEICMS]2.0.CO;2. hdl:10261/50325. PMID 16827001.
- ^ Schwartz, M.K.; et al. (2007). "Inferring geographical isolation of wolverines in California using historical DNA" (PDF). J. Wildl. Manage. 71 (7): 2170–2179. doi:10.2193/2007-026. S2CID 35396299.
- ^ Hitt, N.P.; et al. (2003). "Spread of hybridization between native westslope cutthroat trout, Oncorhynchus clarki lewisi, and nonnative rainbow trout, Oncorhynchus mykiss". Can. J. Fish. Aquat. Sci. 60 (12): 1440–1451. doi:10.1139/F03-125.
- ^ Homyack, J.A.; et al. (2008). "Canada lynx-bobcat (Lynx canadensis x L.rufus) hybrids at the southern periphery of lynx range in Maine, Minnesota and New Brunswick" (PDF). Am. Midl. Nat. 159: 504–508. doi:10.1674/0003-0031(2008)159[504:CLLCLR]2.0.CO;2. S2CID 85843341.
- ^ Schwartz, M.K.; et al. (2004). "Hybridization between Canada lynx and bobcats: Genetic results and management implications" (PDF). Conserv. Genet. 5 (3): 349–355. doi:10.1023/B:COGE.0000031141.47148.8b. S2CID 16786563.
- ^ Kilpatrick, A.M.; et al. (2006). "West Nile Virus epidemics in North America are driven by shifts in mosquito feeding behavior". PLOS Biol. 4 (4): 606–610. doi:10.1371/journal.pbio.0040082. PMC 1382011. PMID 16494532.
- ^ Luikart, G.; et al. (2008). "Candidate gene microsatellite variation is associated with parasitism in wild bighorn sheep" (PDF). Biol. Lett. 4 (2): 228–231. doi:10.1098/rsbl.2007.0633. PMC 2429941. PMID 18270161.
- ^ Lee, C.E. (1999). "Rapid and repeated invasions of fresh water by the copepod Eurytemora affinis" (PDF). Evolution. 53 (5): 1423–1434. doi:10.1111/j.1558-5646.1999.tb05407.x. PMID 28565555. S2CID 205781444.
- ^ Seyoum, S; Tringali, MD; Bielefeld, RR; Feddersen, JC; Benedict Jr, RJ; Fanning, AT; Barthel, B; Curtis, C; Puchulutegui, C; Roberts, ACM; Villanova Jr, VL; Tucker, EC (2012). "Fifty-nine microsatellite markers for hybrid classification studies involving endemic Florida Mottled Duck (Anas fulvigula fulvigula) and invasive Mallards (A. platyrhynchos)". Conservation Genetics Resources. 4 (3): 681–687. doi:10.1007/s12686-012-9622-9. S2CID 16072813.
- ^ Haig, S.M.; et al. (2004). "Genetic identification of spotted owls, barred owls and their hybrids: legal implications of hybrid identity". Conserv. Biol. 18 (5): 1347–1357. doi:10.1111/j.1523-1739.2004.00206.x. S2CID 43989899.
- ^ Azzurro, E.; et al. (2006). "Genetics of the early stages of invasion of the Lessepsian rabbitfish Siganus luridus" (PDF). J. Exp. Mar. Biol. Ecol. 333 (2): 190–201. doi:10.1016/j.jembe.2005.12.002. Archived from the original (PDF) on 2011-07-16. Retrieved 2009-04-01.
- ^ a b c Baker, C.S. (2008). "A truer measure of the market: the molecular ecology of fisheries and wildlife trade". Mol. Ecol. 17 (18): 3985–3998. doi:10.1111/j.1365-294X.2008.03867.x. PMID 18643915.
- ^ Baker, C.S.; et al. (2007). "Estimating the number of whales entering trade using DNA profiling and capture-recapture analysis of market products". Mol. Ecol. 16 (13): 2617–2626. doi:10.1111/j.1365-294X.2007.03317.x. PMID 17594434. S2CID 25938493.
- ^ Malik, S.; et al. (1997). "Pinniped penises in trade: a molecular genetic investigation". Conserv. Biol. 11 (6): 1365–1374. doi:10.1046/j.1523-1739.1997.96125.x. S2CID 86541791.
- ^ Sanders, J.G.; et al. (2008). "The tip of the tail: molecular identification of seahorses for sale in apothecary shops and curio stores in California". Conserv. Genet. 9: 65–71. doi:10.1007/s10592-007-9308-0. S2CID 15874239.
- ^ Clarke, S.C.; et al. (2006). "Identification of shark species composition and proportion in the Hong Kong shark fin market based on molecular genetics and trade records". Conserv. Biol. 20 (1): 201–211. doi:10.1111/j.1523-1739.2005.00247.x. PMID 16909673. S2CID 26719257.
- ^ Shapiro, B.; et al. (2004). "Rise and fall of the Beringian Steppe Bison". Science. 306 (5701): 1561–1565. Bibcode:2004Sci...306.1561S. doi:10.1126/science.1101074. PMID 15567864. S2CID 27134675.
- ^ Poulakakis, N.; et al. (2008). "Historical DNA analysis reveals living descendants of an extinct species of Galápagos tortoise" (PDF). Proc. Natl. Acad. Sci. USA. 105 (40): 15464–15469. doi:10.1073/pnas.0805340105. PMC 2563078. PMID 18809928.
- ^ Hansen, M.M.; et al. (2006). "Underwater but not out of sight: genetic monitoring of effective population size in the endangered North Sea houting (Coregonus oxyrhynchus)". Can. J. Fish. Aquat. Sci. 63 (4): 780–787. doi:10.1139/F05-260.
- ^ Nielsen, E.E.; et al. (1999). "Genetic variation in time and space: Microsatellite analysis of extinct and extant populations of Atlantic salmon". Evolution. 53 (1): 261–268. doi:10.1111/j.1558-5646.1999.tb05351.x. PMID 28565198.
- ^ Miller, L.M.; Kapuscinski, A.R. (1997). "Historical analysis of genetic variation reveals low effective population size in a northern pike (Esox lucius) population" (PDF). Genetics. 147 (3): 1249–1258. doi:10.1093/genetics/147.3.1249. PMC 1208248. PMID 9383067.
- ^ Hauser, L.; et al. (2002). "Loss of microsatellite diversity and low effective population size in an overexploited population of New Zealand snapper (Pagrus auratus)". Proc. Natl. Acad. Sci. USA. 99 (18): 11742–11747. Bibcode:2002PNAS...9911742H. doi:10.1073/pnas.172242899. PMC 129339. PMID 12185245.
- ^ Heath, D.D.; et al. (2002). "Temporal change in genetic structure and effective population size in steelhead trout (Oncorhynchus mykiss)". Mol. Ecol. 11 (2): 197–214. doi:10.1046/j.1365-294X.2002.01434.x. PMID 11856422. S2CID 23598245.
- ^ Bellinger, M.R. (2003). "Loss of genetic variation in greater prairie chickens following a population bottleneck in Wisconsin, USA". Conserv. Biol. 17 (3): 717–724. doi:10.1046/j.1523-1739.2003.01581.x. S2CID 4988537.
- ^ Groombridge, J.J.; et al. (2000). "'Ghost' alleles of the Mauritius kestrel". Nature. 403 (6770): 616. doi:10.1038/35001148. PMID 10688188. S2CID 4336347.
- ^ Pichler, F.B.; Baker, C.S. (2000). "Loss of genetic diversity in the endemic Hector's dolphin due to fisheries-related mortality". Proc. R. Soc. Lond. B. 267 (1438): 97–102. doi:10.1098/rspb.2000.0972. PMC 1690489. PMID 10670959.
- ^ Østergaard, S.; et al. (2003). "Long-term temporal changes of genetic composition in brown trout (Salmo trutta L.) populations inhabiting an unstable environment". Mol. Ecol. 12 (11): 3123–3135. doi:10.1046/j.1365-294X.2003.01976.x. PMID 14629391. S2CID 44258175.
- ^ Palm, S.; et al. (2003). "Effective population size and temporal genetic change in stream resident brown trout (Salmo trutta, L.)". Conserv. Genet. 4 (3): 249–264. doi:10.1023/A:1024064913094. S2CID 22607075.
- ^ a b Kendall, K.C.; et al. (2009). "Demography and genetic structure of a recovering grizzly bear population". J. Wildl. Manage. 73: 3–17. doi:10.2193/2008-330. S2CID 52249993.
- ^ Proctor, M.F.; et al. (2005). "Genetic analysis reveals demographic fragmentation of grizzly bears yielding vulnerably small populations". Proc. R. Soc. Lond. B. 272 (1579): 2409–2416. doi:10.1098/rspb.2005.3246. PMC 1559960. PMID 16243699.
- ^ Poulsen, N.A.; et al. (2006). "Long-term stability and effective population size in North Sea and Baltic Sea cod (Gadus morhua)". Mol. Ecol. 15 (2): 321–331. doi:10.1111/j.1365-294X.2005.02777.x. PMID 16448403. S2CID 20349824.
- ^ Nussey, D.H.; et al. (2005). "Rapidly declining fine-scale spatial genetic structure in female red deer" (PDF). Mol. Ecol. 14 (11): 3395–3405. doi:10.1111/j.1365-294X.2005.02692.x. PMID 16156811. S2CID 28250600. Archived from the original (PDF) on 2016-03-03. Retrieved 2009-04-01.
- ^ Hoffman, E.A.; Blouin, M.S. (2004). "Historical data refute recent range contraction as cause of low genetic diversity in isolated frog populations" (PDF). Mol. Ecol. 13 (2): 271–276. doi:10.1046/j.1365-294X.2003.02057.x. PMID 14717886. S2CID 12815666. Archived from the original (PDF) on 2010-06-03. Retrieved 2021-06-12.
- ^ Bonnin, I.; et al. (2001). "Spatial effects and rare outcrossing events in Medicago truncatula (Fabaceae)". Mol. Ecol. 10 (6): 1371–1383. doi:10.1046/j.1365-294X.2001.01278.x. PMID 11412361. S2CID 23585208.
- ^ Siol, M.; et al. (2007). "Effective population size associated with self-fertilization: lessons from temporal changes in allele frequencies in the selfing annual Medicago truncatula". J. Evol. Biol. 20 (6): 2349–2360. doi:10.1111/j.1420-9101.2007.01409.x. PMID 17956396.
- ^ Bradshaw, W.E.; Holzapfel, C.M. (2001). "Genetic shift in photoperiodic response correlated with global warming". Proc. Natl. Acad. Sci. USA. 98 (25): 14509–14511. doi:10.1073/pnas.241391498. PMC 64712. PMID 11698659.
- ^ Rhoné, B.; et al. (2008). "Insight into the genetic bases of climatic adaptation in experimentally evolving wheat populations". Mol. Ecol. 17 (3): 930–943. doi:10.1111/j.1365-294X.2007.03619.x. PMID 18194164. S2CID 7810825.
- ^ Strasburg, J.L.; Gross, B.L. (2008). "Adapting to winter in wheat: a long-term study follows parallel phenotypic and genetic changes in three experimental wheat populations". Mol. Ecol. 17 (3): 716–718. doi:10.1111/j.1365-294X.2007.03639.x. PMID 18194165.
- ^ Ardern, S.L.; Lambert, D.M. (1997). "Is the black robin in genetic peril?". Mol. Ecol. 6 (1): 21–28. doi:10.1046/j.1365-294X.1997.00147.x. S2CID 84475847.
- ^ Miller, H.C.; et al. (2003). "Minisatellite DNA profiling detects lineages and parentage in endangered kakapo (Strigops habroptilus) despite low microsatellite DNA variation". Conserv. Genet. 4 (3): 265–274. doi:10.1023/A:1024037601708. S2CID 8877634.
- ^ Pearman, P.B.; Broennimann, O.; et al. (2024). "Monitoring of species' genetic diversity in Europe varies greatly and overlooks potential climate change impacts". Nat. Ecol. Evol. doi:10.1038/s41559-023-02260-0. PMC 10857941. S2CID 266998582.
- ^ "A Report on the Results and Recommendations of the International Summit on Evolutionary Change in Human-altered Environments" (PDF). Archived from the original (PDF) on 2010-07-11. Retrieved 2009-04-01.
- ^ National Center for Ecological Analysis and Synthesis
- ^ The National Evolutionary Synthesis Center
- ^ "Genetic Monitoring: Development of Tools for Conservation and Management". Archived from the original on 2009-06-15. Retrieved 2009-04-01.
- ^ Rocky Mountain Research Station Wildlife Genetics Laboratory
External links
- Genetic Monitoring For Managers
- Science Centric Report of Grizzly Bear study in northwest Montana[permanent dead link]
- New Scientist Article – Snow leopard numbers can be read in their scat
- Animals' scat is scientist's treasure: Advances in DNA testing let wildlife biologists study creatures using what they leave behind
- Post Gazette News: Aviary researcher finds Eagles need a closer look
- New Scientist- Hidden Populations give Lynx a fighting chance
- SFGate: It's True – wolverine is thriving near Tahoe
- Associated Press: Protected Trout is breeding itself into Extinction
- Adapting to a warmer climate: the purple pitcher plant mosquito