
File:HighSensitivity LowSpecificity 1401x1050.png
Size of this preview: 800 × 600 pixels. Other resolutions: 320 × 240 pixels | 640 × 480 pixels | 1,024 × 767 pixels | 1,280 × 959 pixels | 1,401 × 1,050 pixels.
Original file (1,401 × 1,050 pixels, file size: 93 KB, MIME type: image/png)
| This is a file from the Wikimedia Commons. Information from its description page there is shown below. Commons is a freely licensed media file repository. You can help. |

|
This diagram image could be re-created using vector graphics as an SVG file. This has several advantages; see Commons:Media for cleanup for more information. If an SVG form of this image is available, please upload it and afterwards replace this template with
{{vector version available|new image name}}.
It is recommended to name the SVG file “HighSensitivity LowSpecificity 1401x1050.svg”—then the template Vector version available (or Vva) does not need the new image name parameter. |
Summary
| Description |
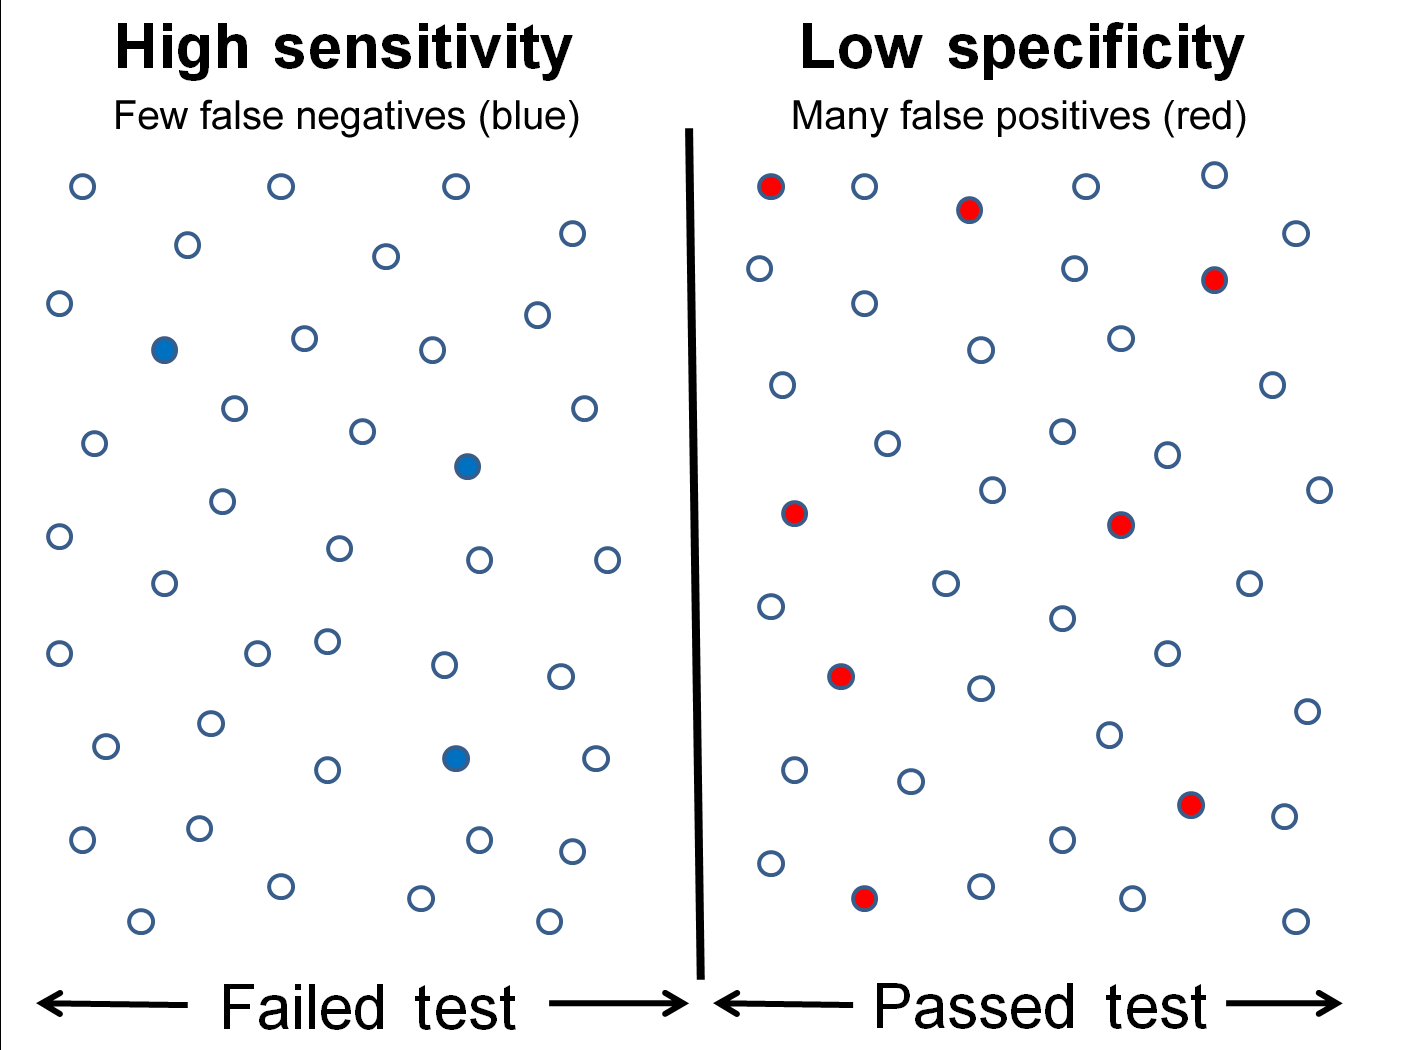
English: Graphical illustration of high sensitivity and low specificity. Each data point is represented by a circle. Data which failed the test are drawn on the left side of the vertical bar and data which passed the test are drawn on the right side of the vertical bar. False negatives are shown as closed blue circles in the left panel and false positives are shown as closed red circles in the right panel. All other data points (open circles) are either true negatives (on the left) or true positives (on the right). |
| Date | |
| Source | Own work |
| Author | Rmostell |
| Other versions |
[]
|


Licensing
I, the copyright holder of this work, hereby publish it under the following license:
| This file is made available under the Creative Commons CC0 1.0 Universal Public Domain Dedication. | |
| The person who associated a work with this deed has dedicated the work to the public domain by waiving all of their rights to the work worldwide under copyright law, including all related and neighboring rights, to the extent allowed by law. You can copy, modify, distribute and perform the work, even for commercial purposes, all without asking permission.
|
File history
Click on a date/time to view the file as it appeared at that time.
| Date/Time | Thumbnail | Dimensions | User | Comment | |
|---|---|---|---|---|---|
| current | 23:54, 14 May 2020 | | 1,401 × 1,050 (93 KB) | Nyq | decapitalized common nouns |
| 21:55, 6 March 2011 |  | 1,401 × 1,050 (77 KB) | Rmostell | {{Information |Description ={{en|1=Graphical illustration of high sensitivity and low specificity. Each data point is represented by a circle. Data which failed the test are drawn on the left side of the vertical bar and data which passed the test are |
File usage
The following pages on the English Wikipedia use this file (pages on other projects are not listed):
Global file usage
The following other wikis use this file:
- Usage on ar.wikipedia.org
- Usage on fa.wikipedia.org
- Usage on th.wikipedia.org
- Usage on ur.wikipedia.org